
Quantitative study on grouting plugging effect of loaded fractured coal sample based on CT scanning
-
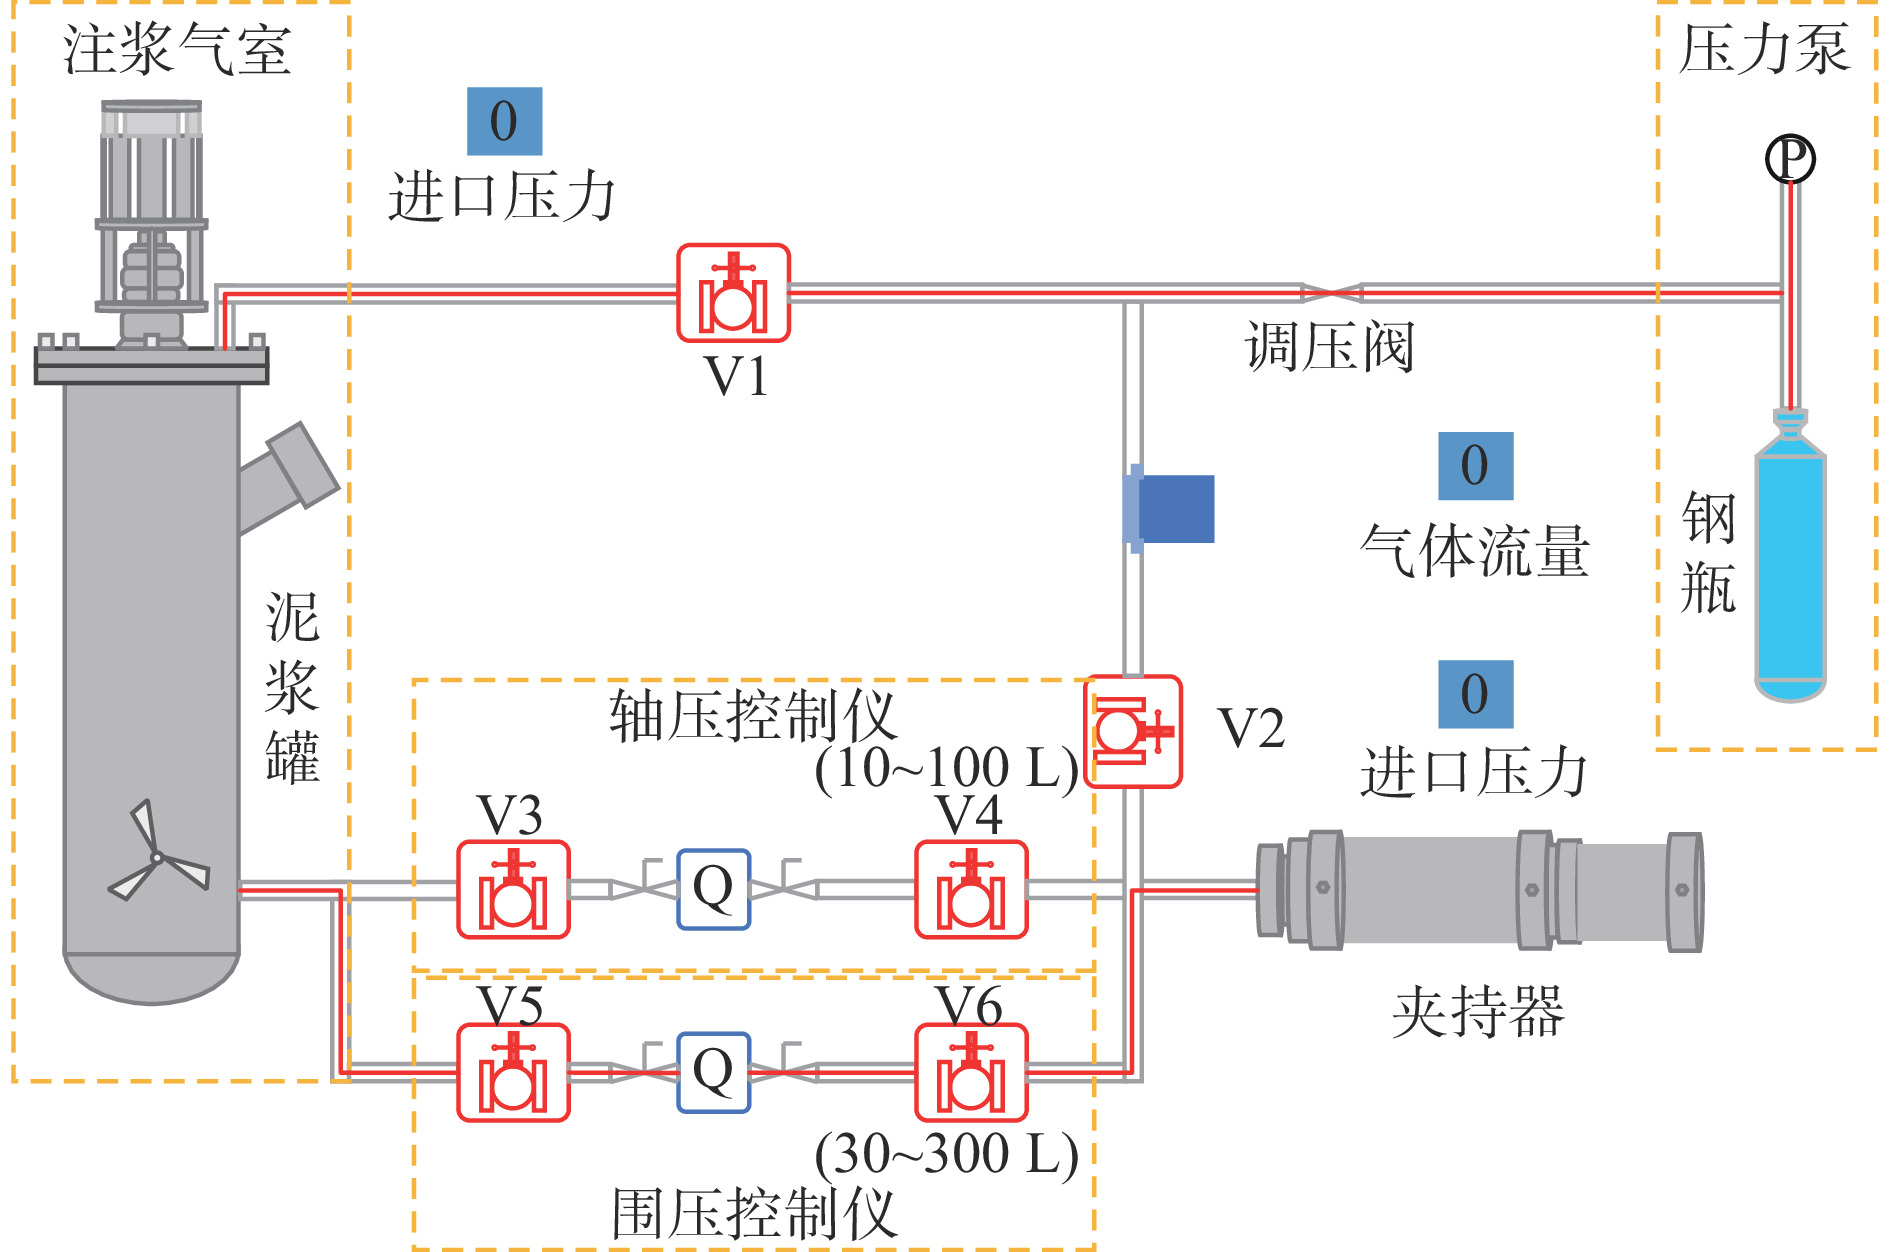
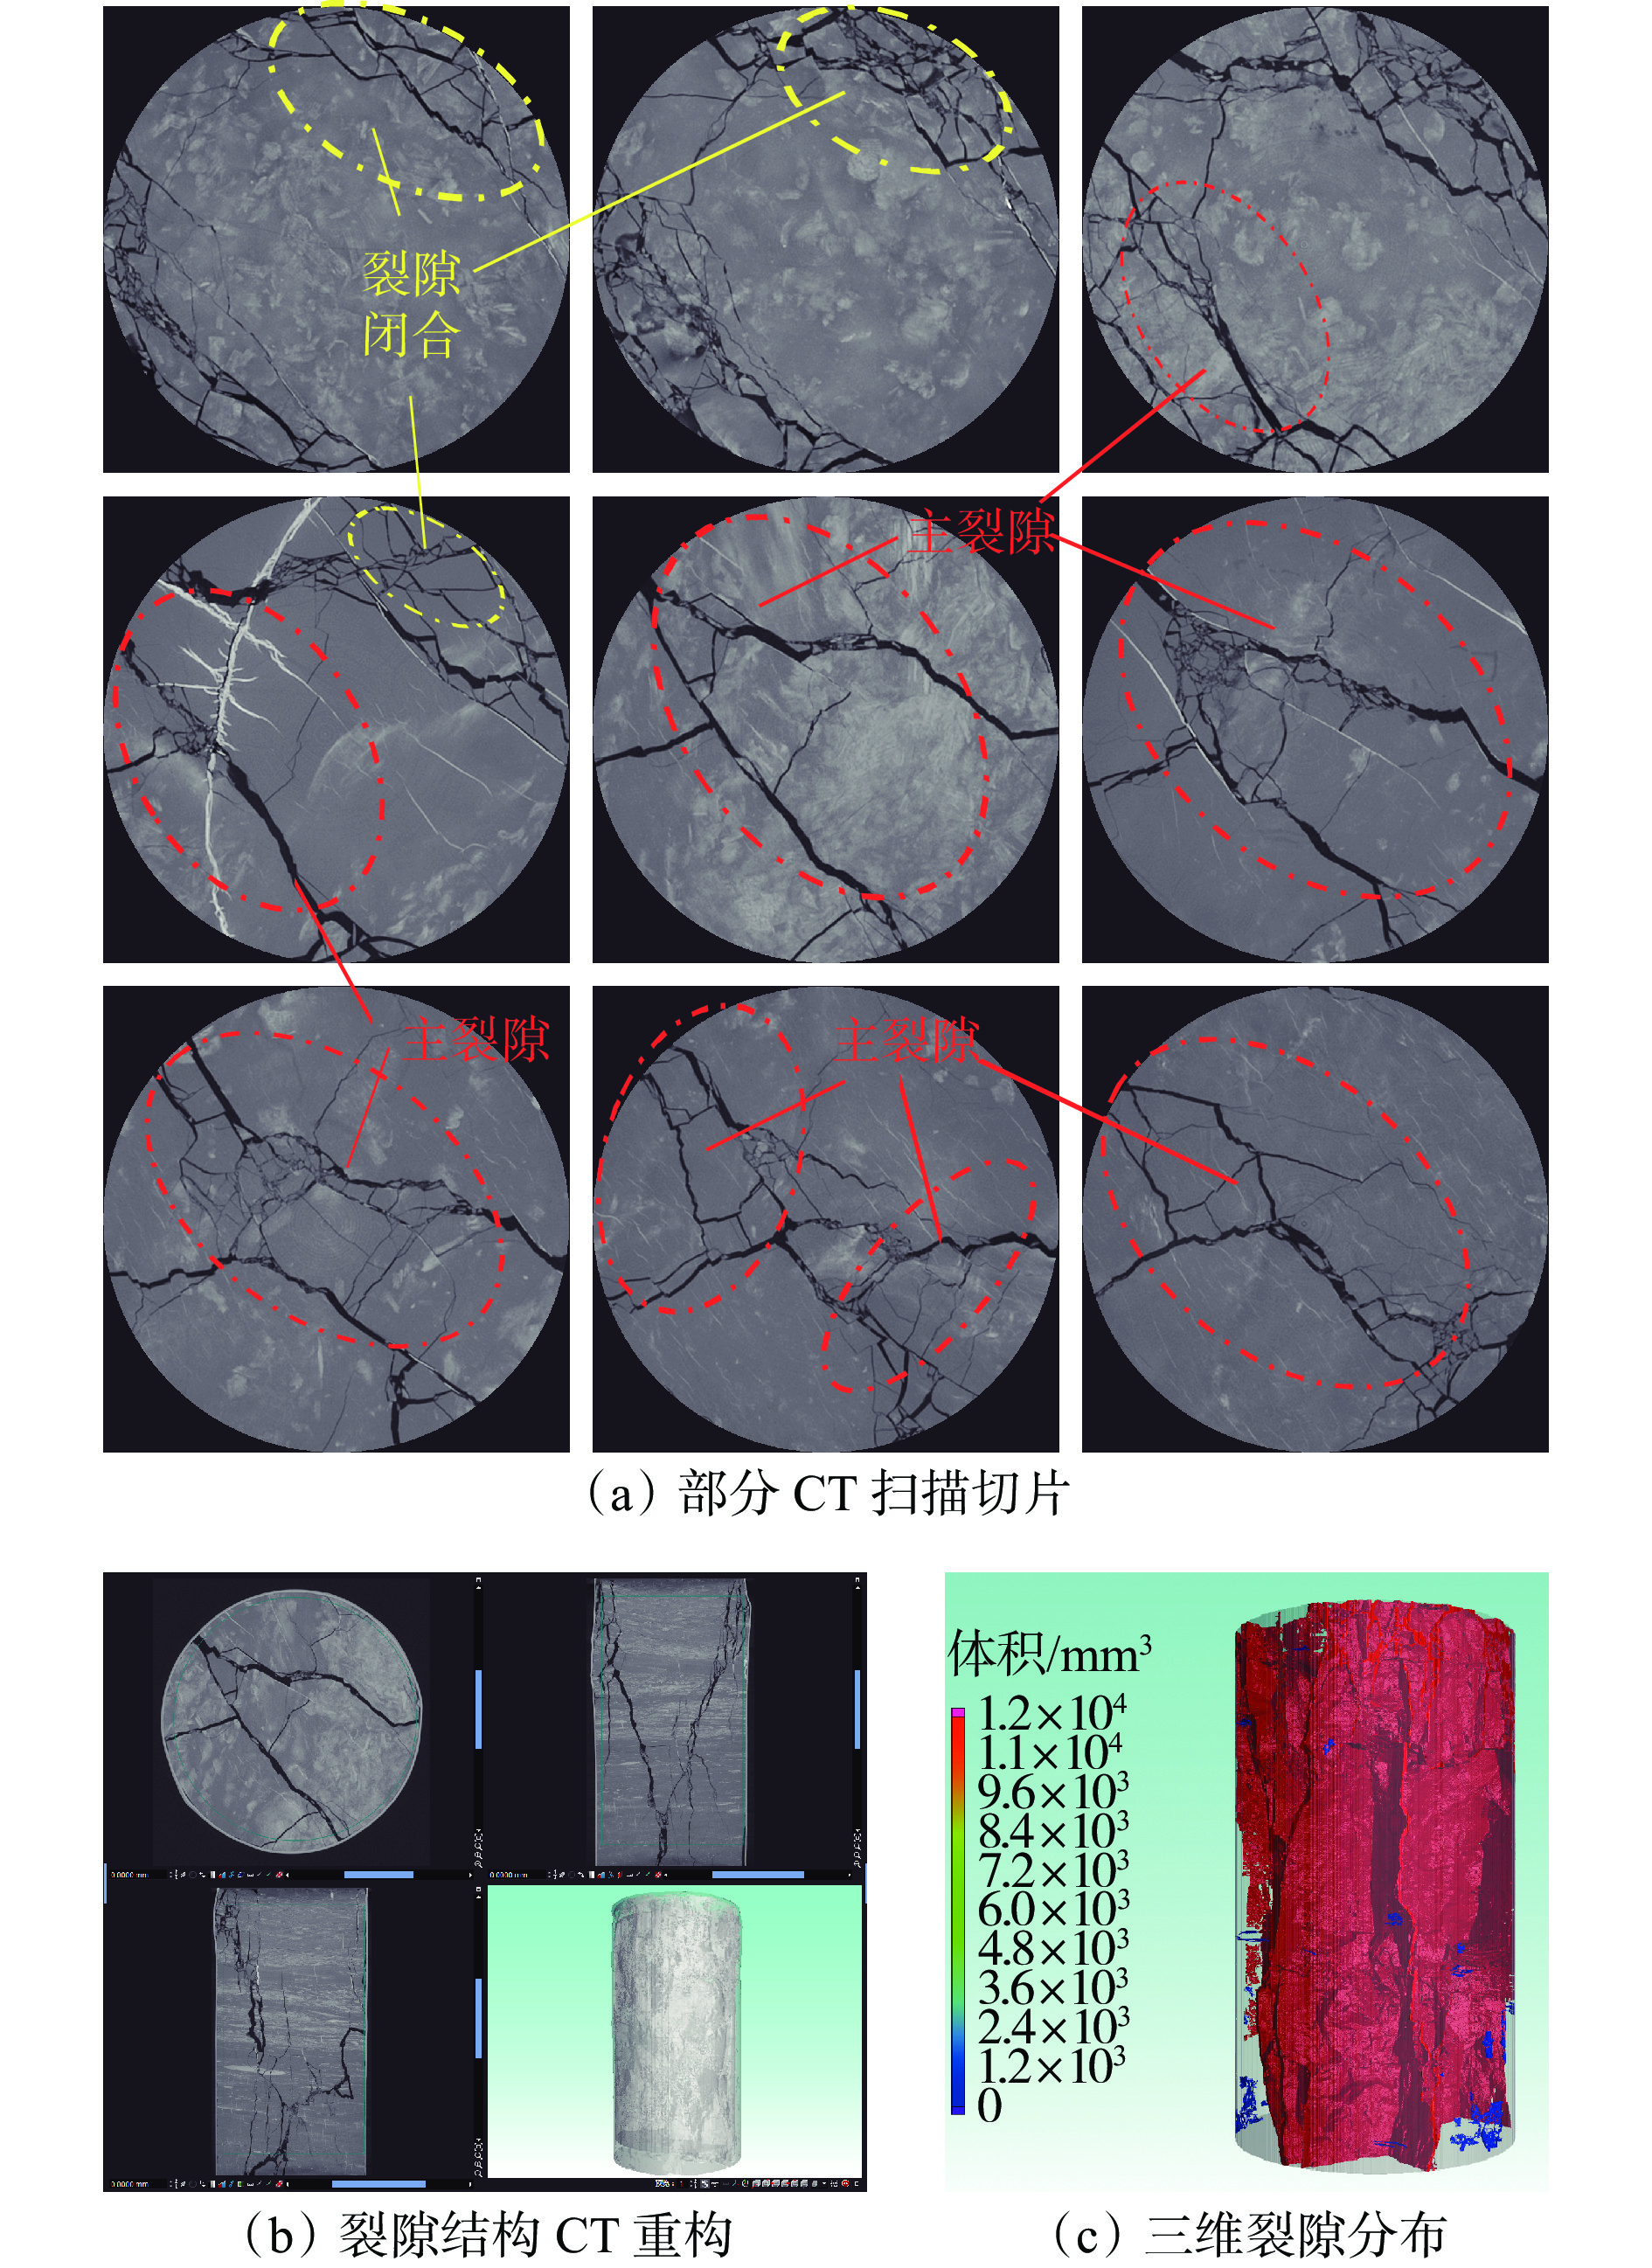
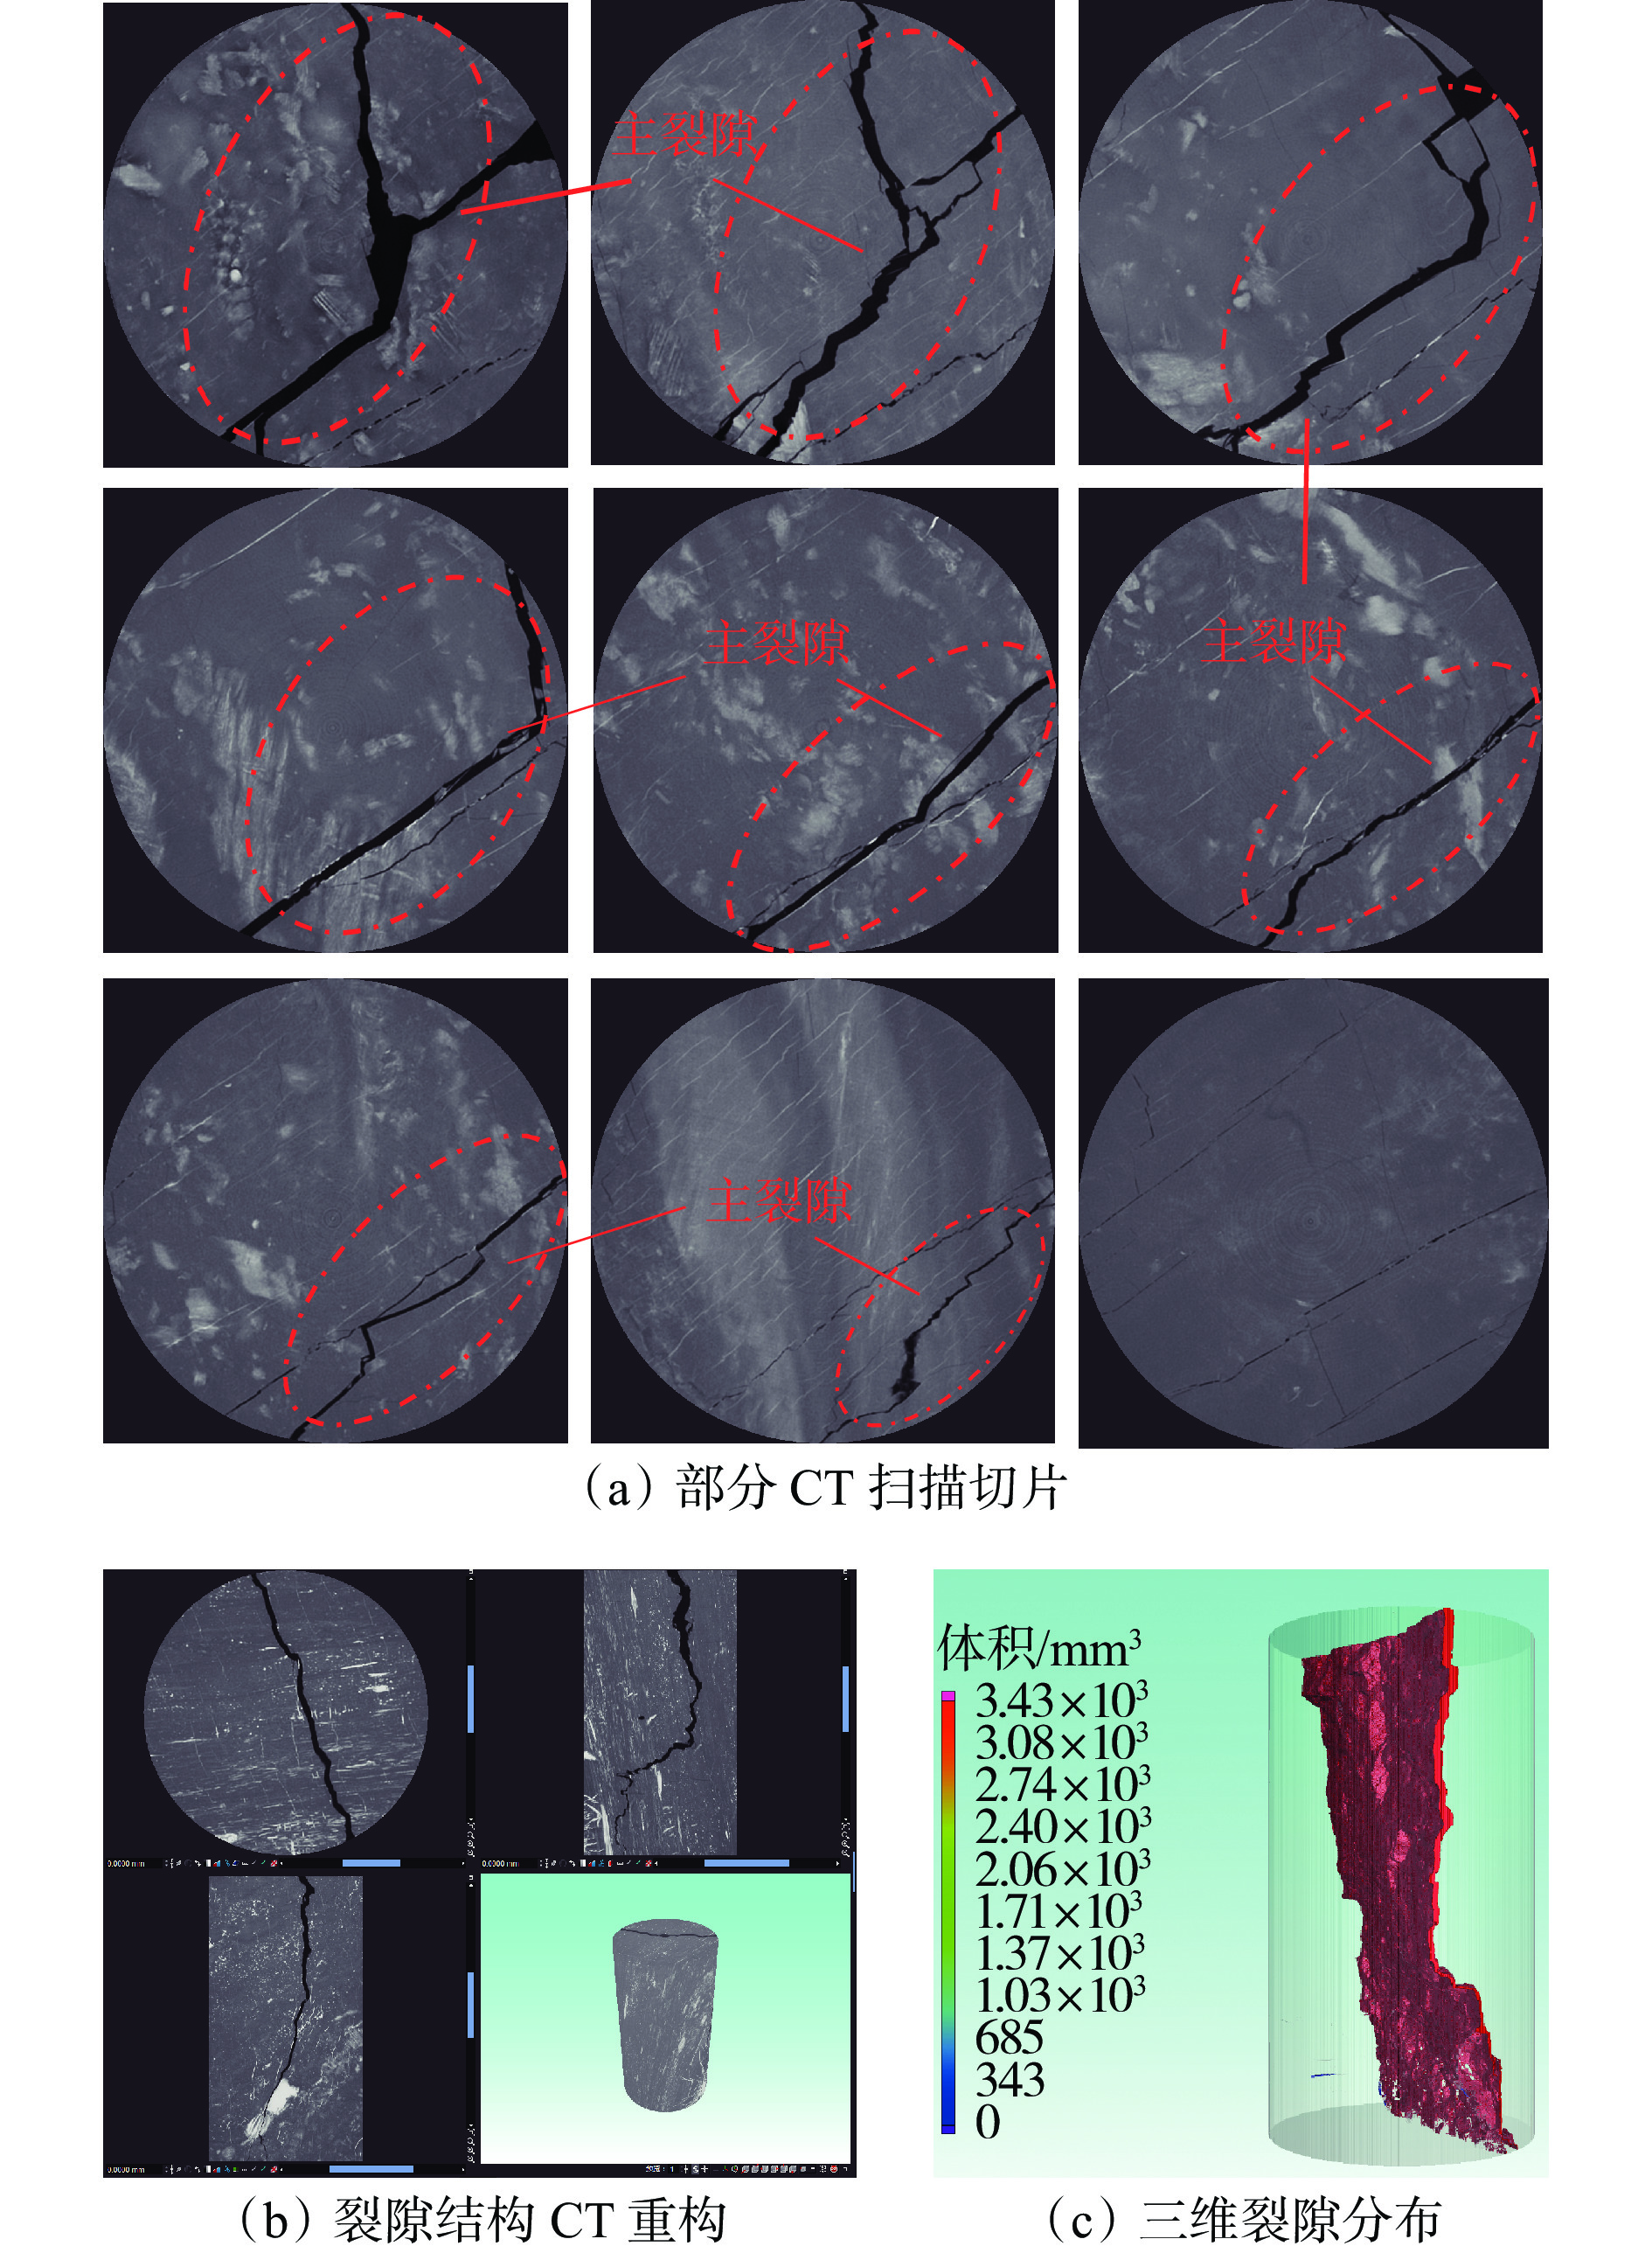
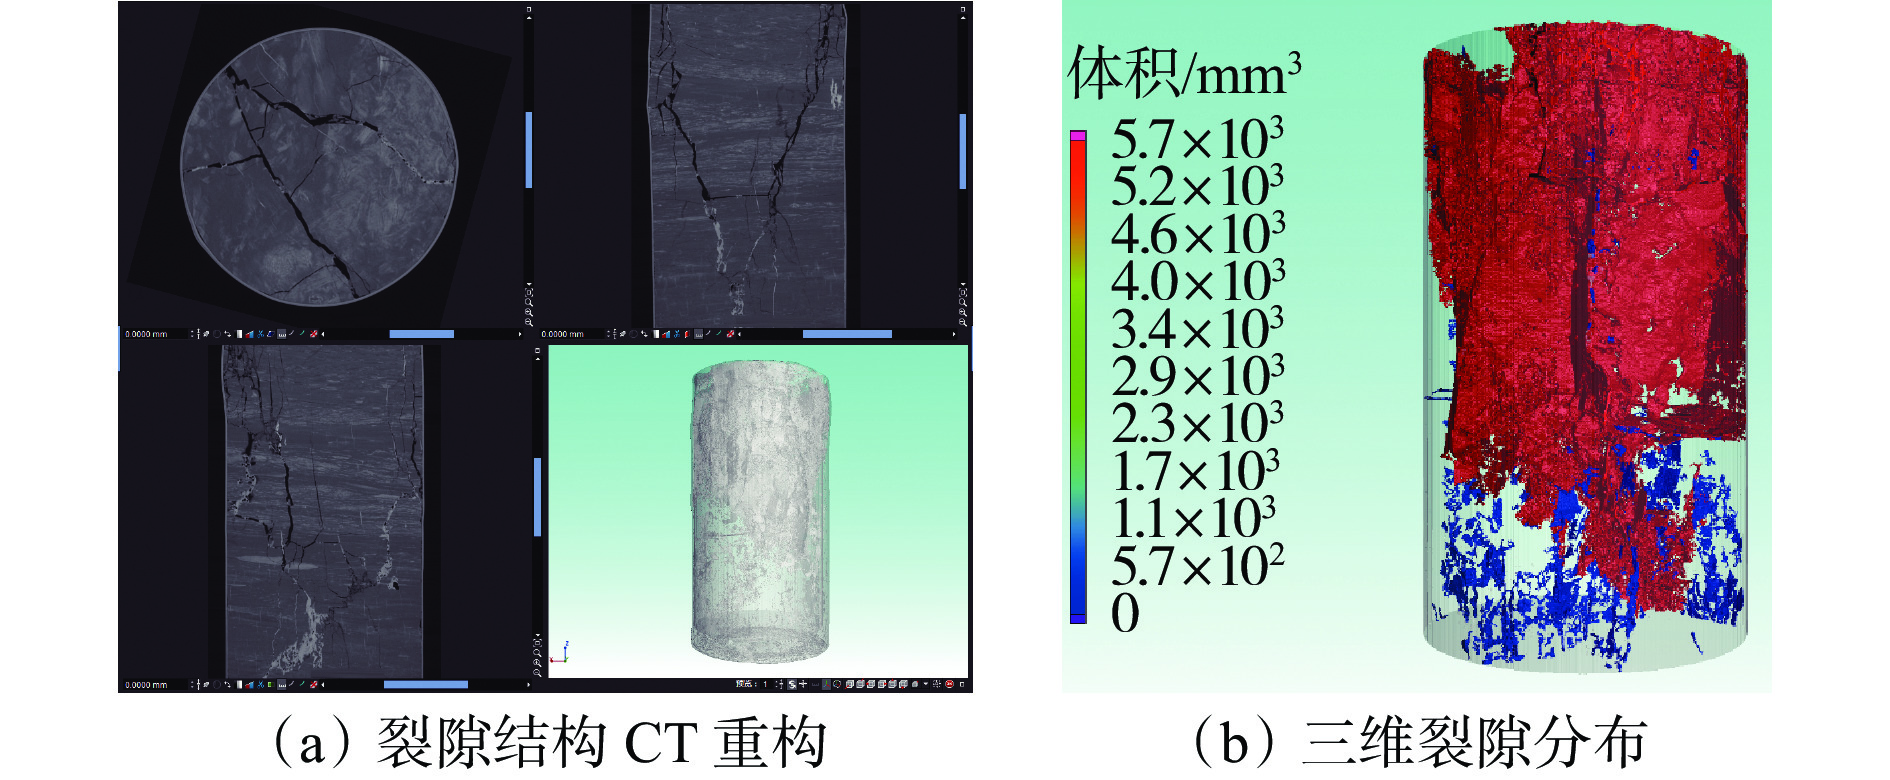
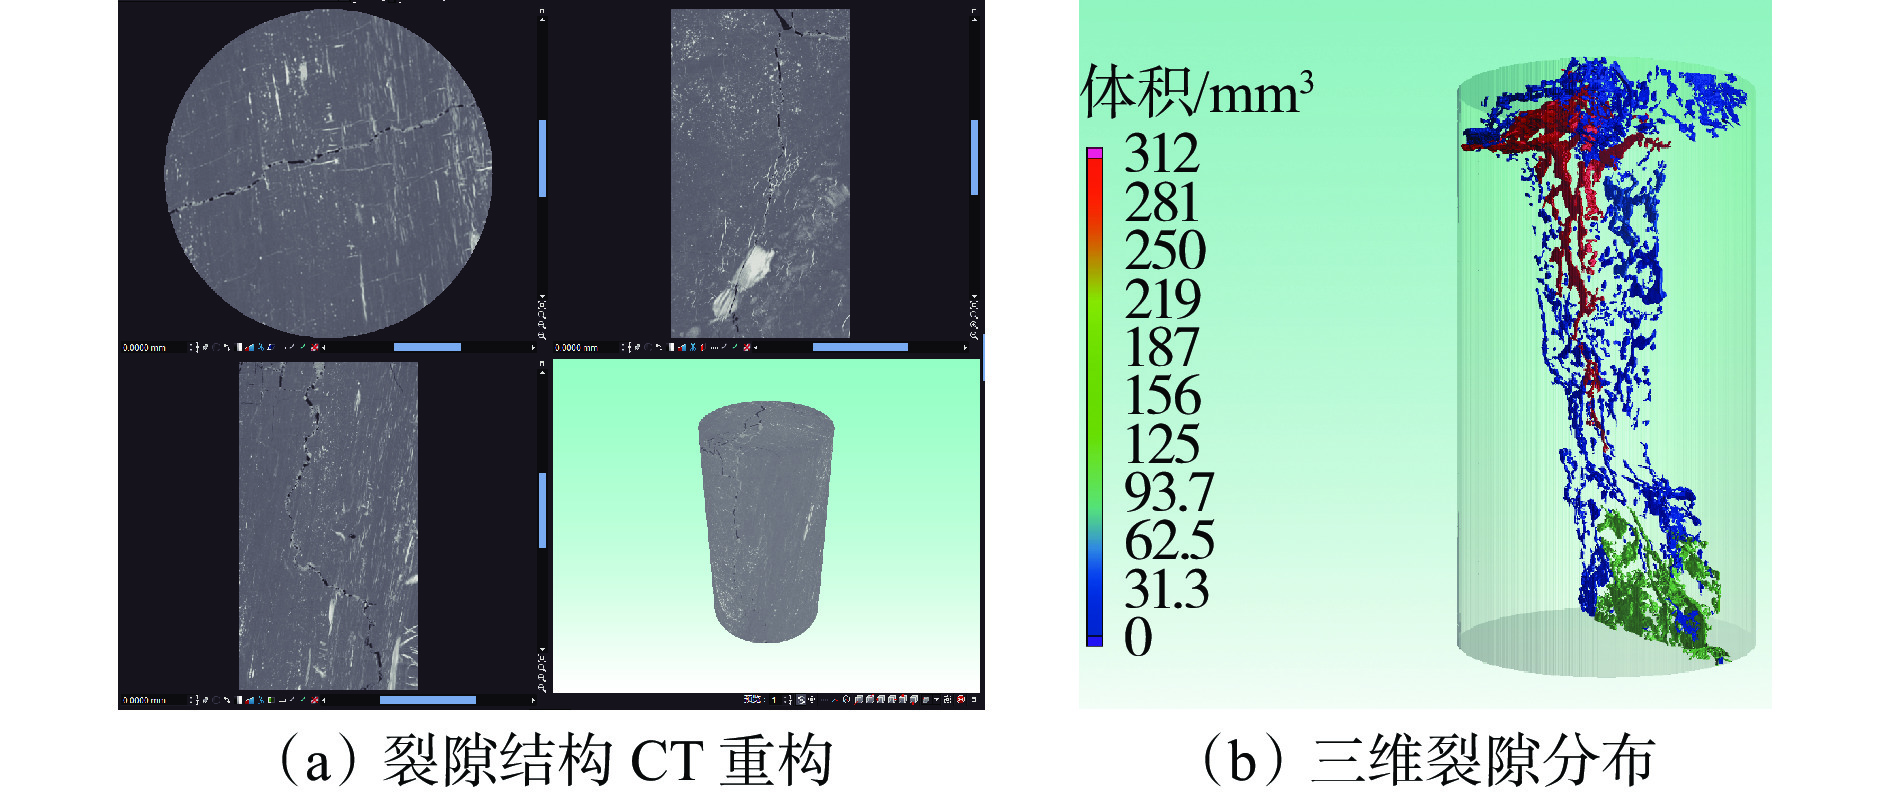
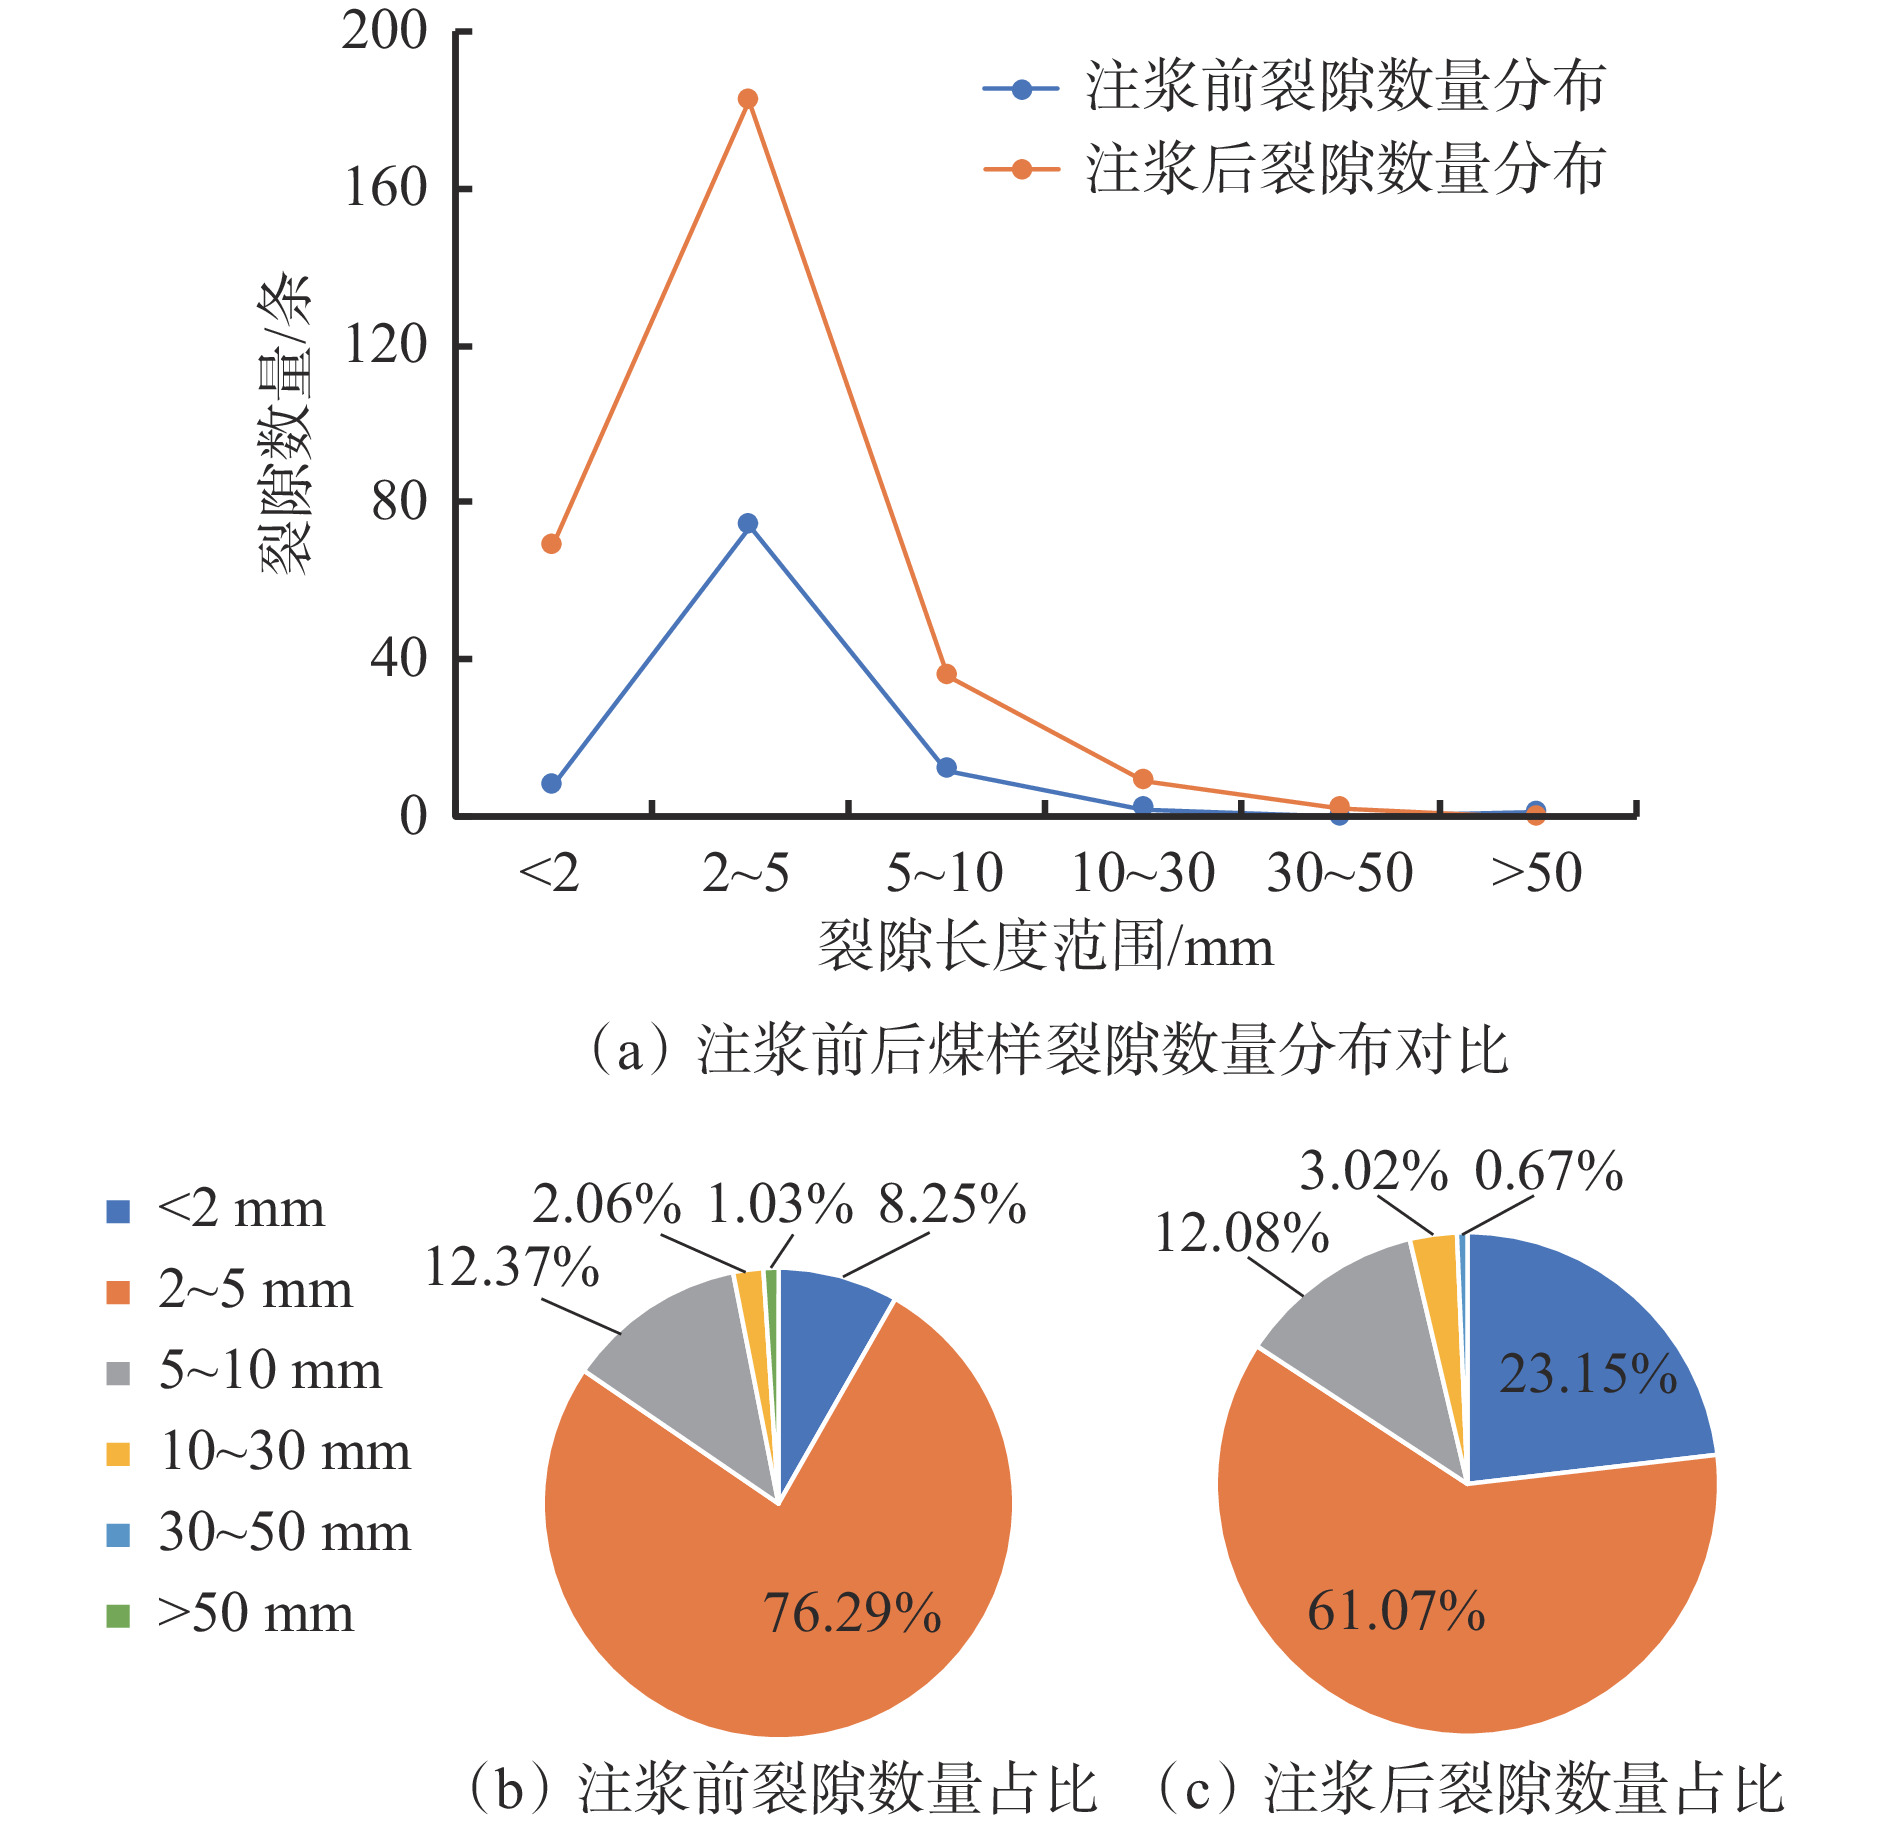
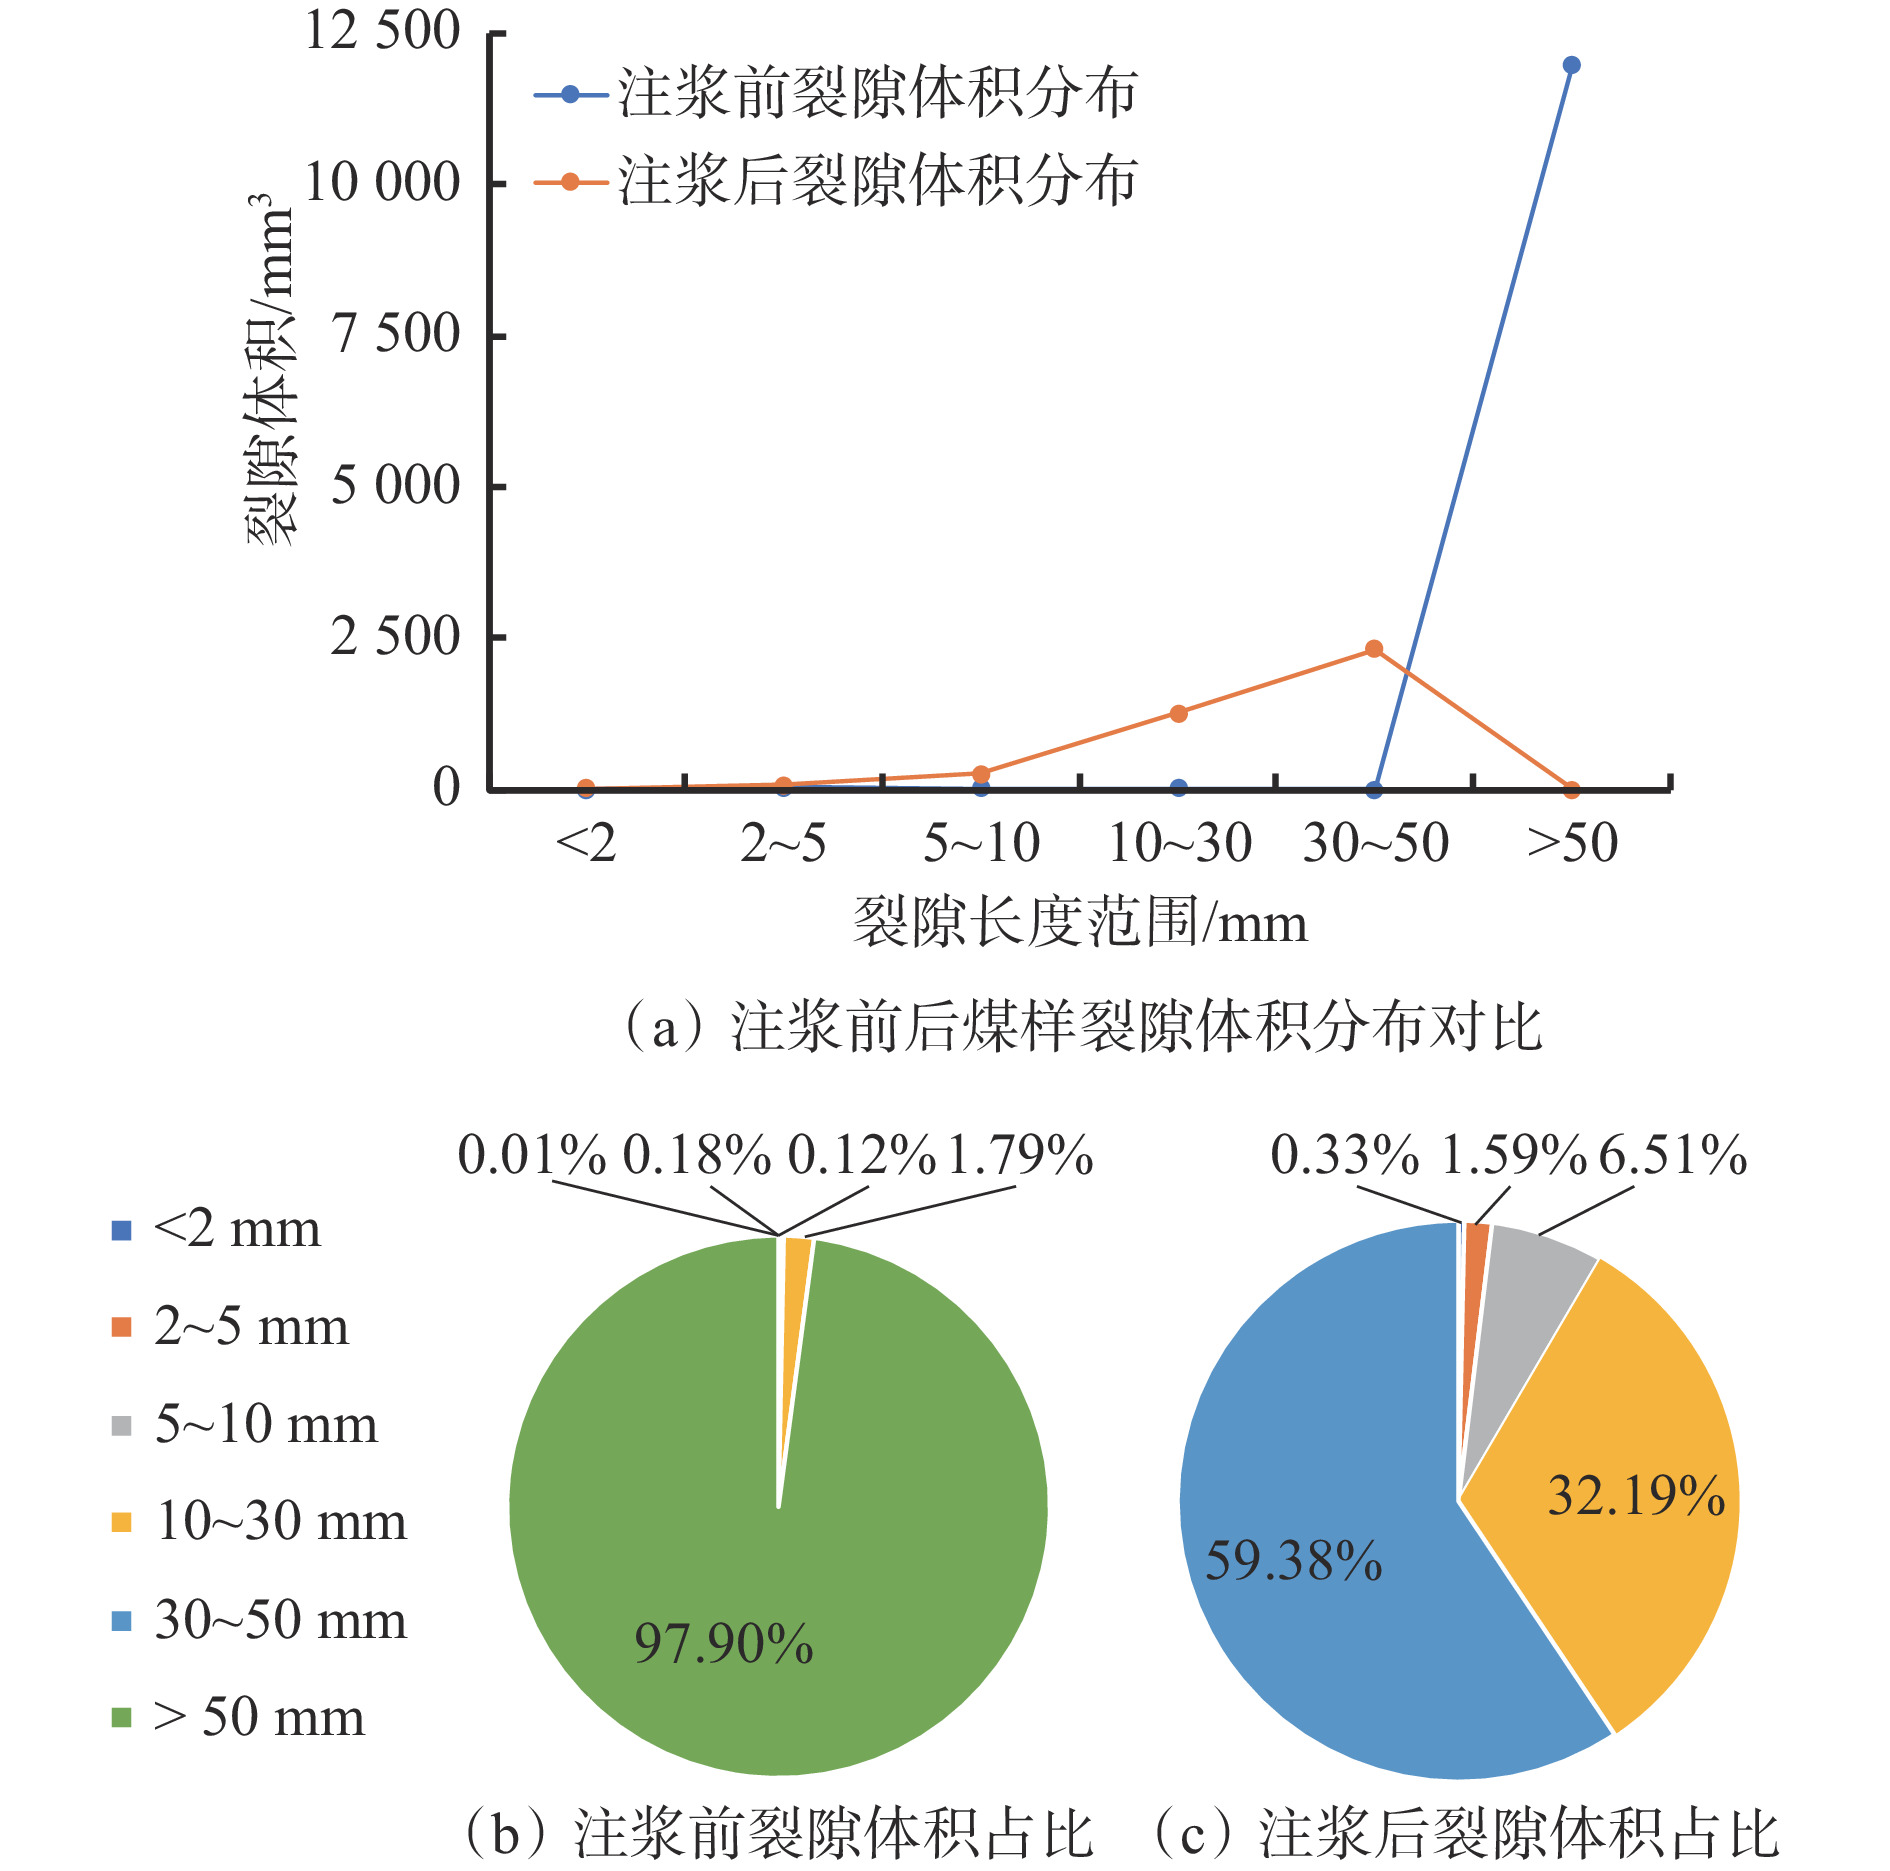
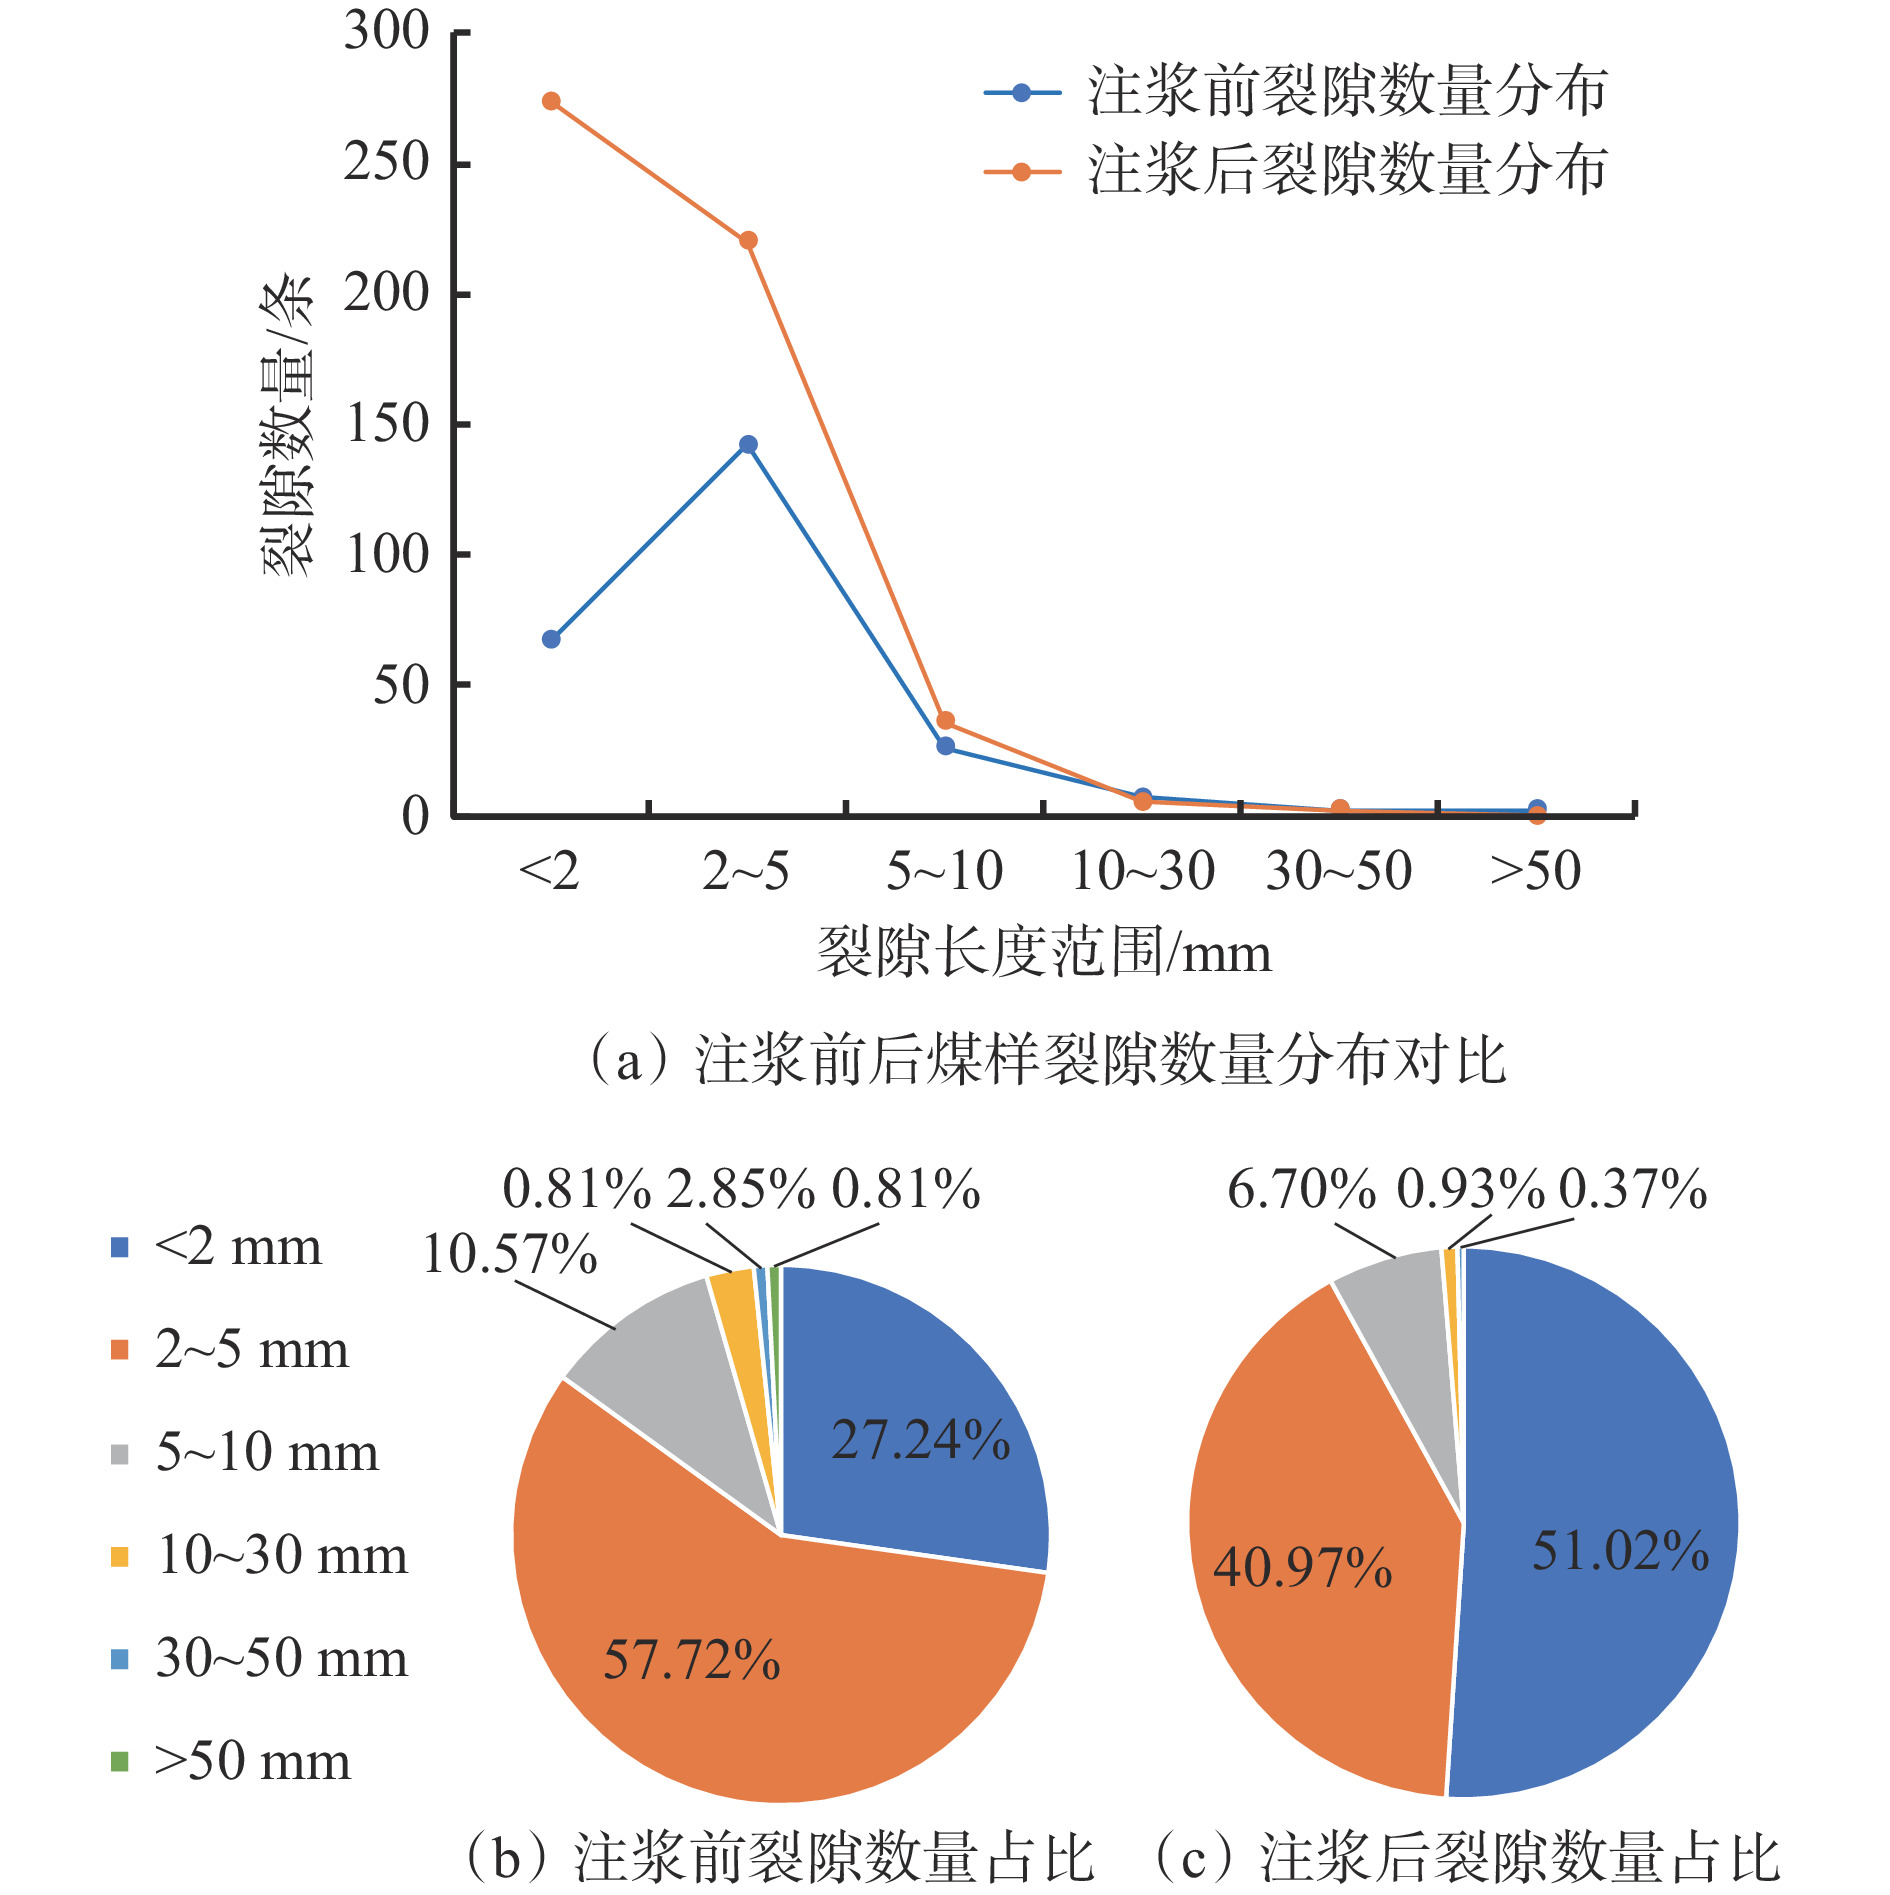
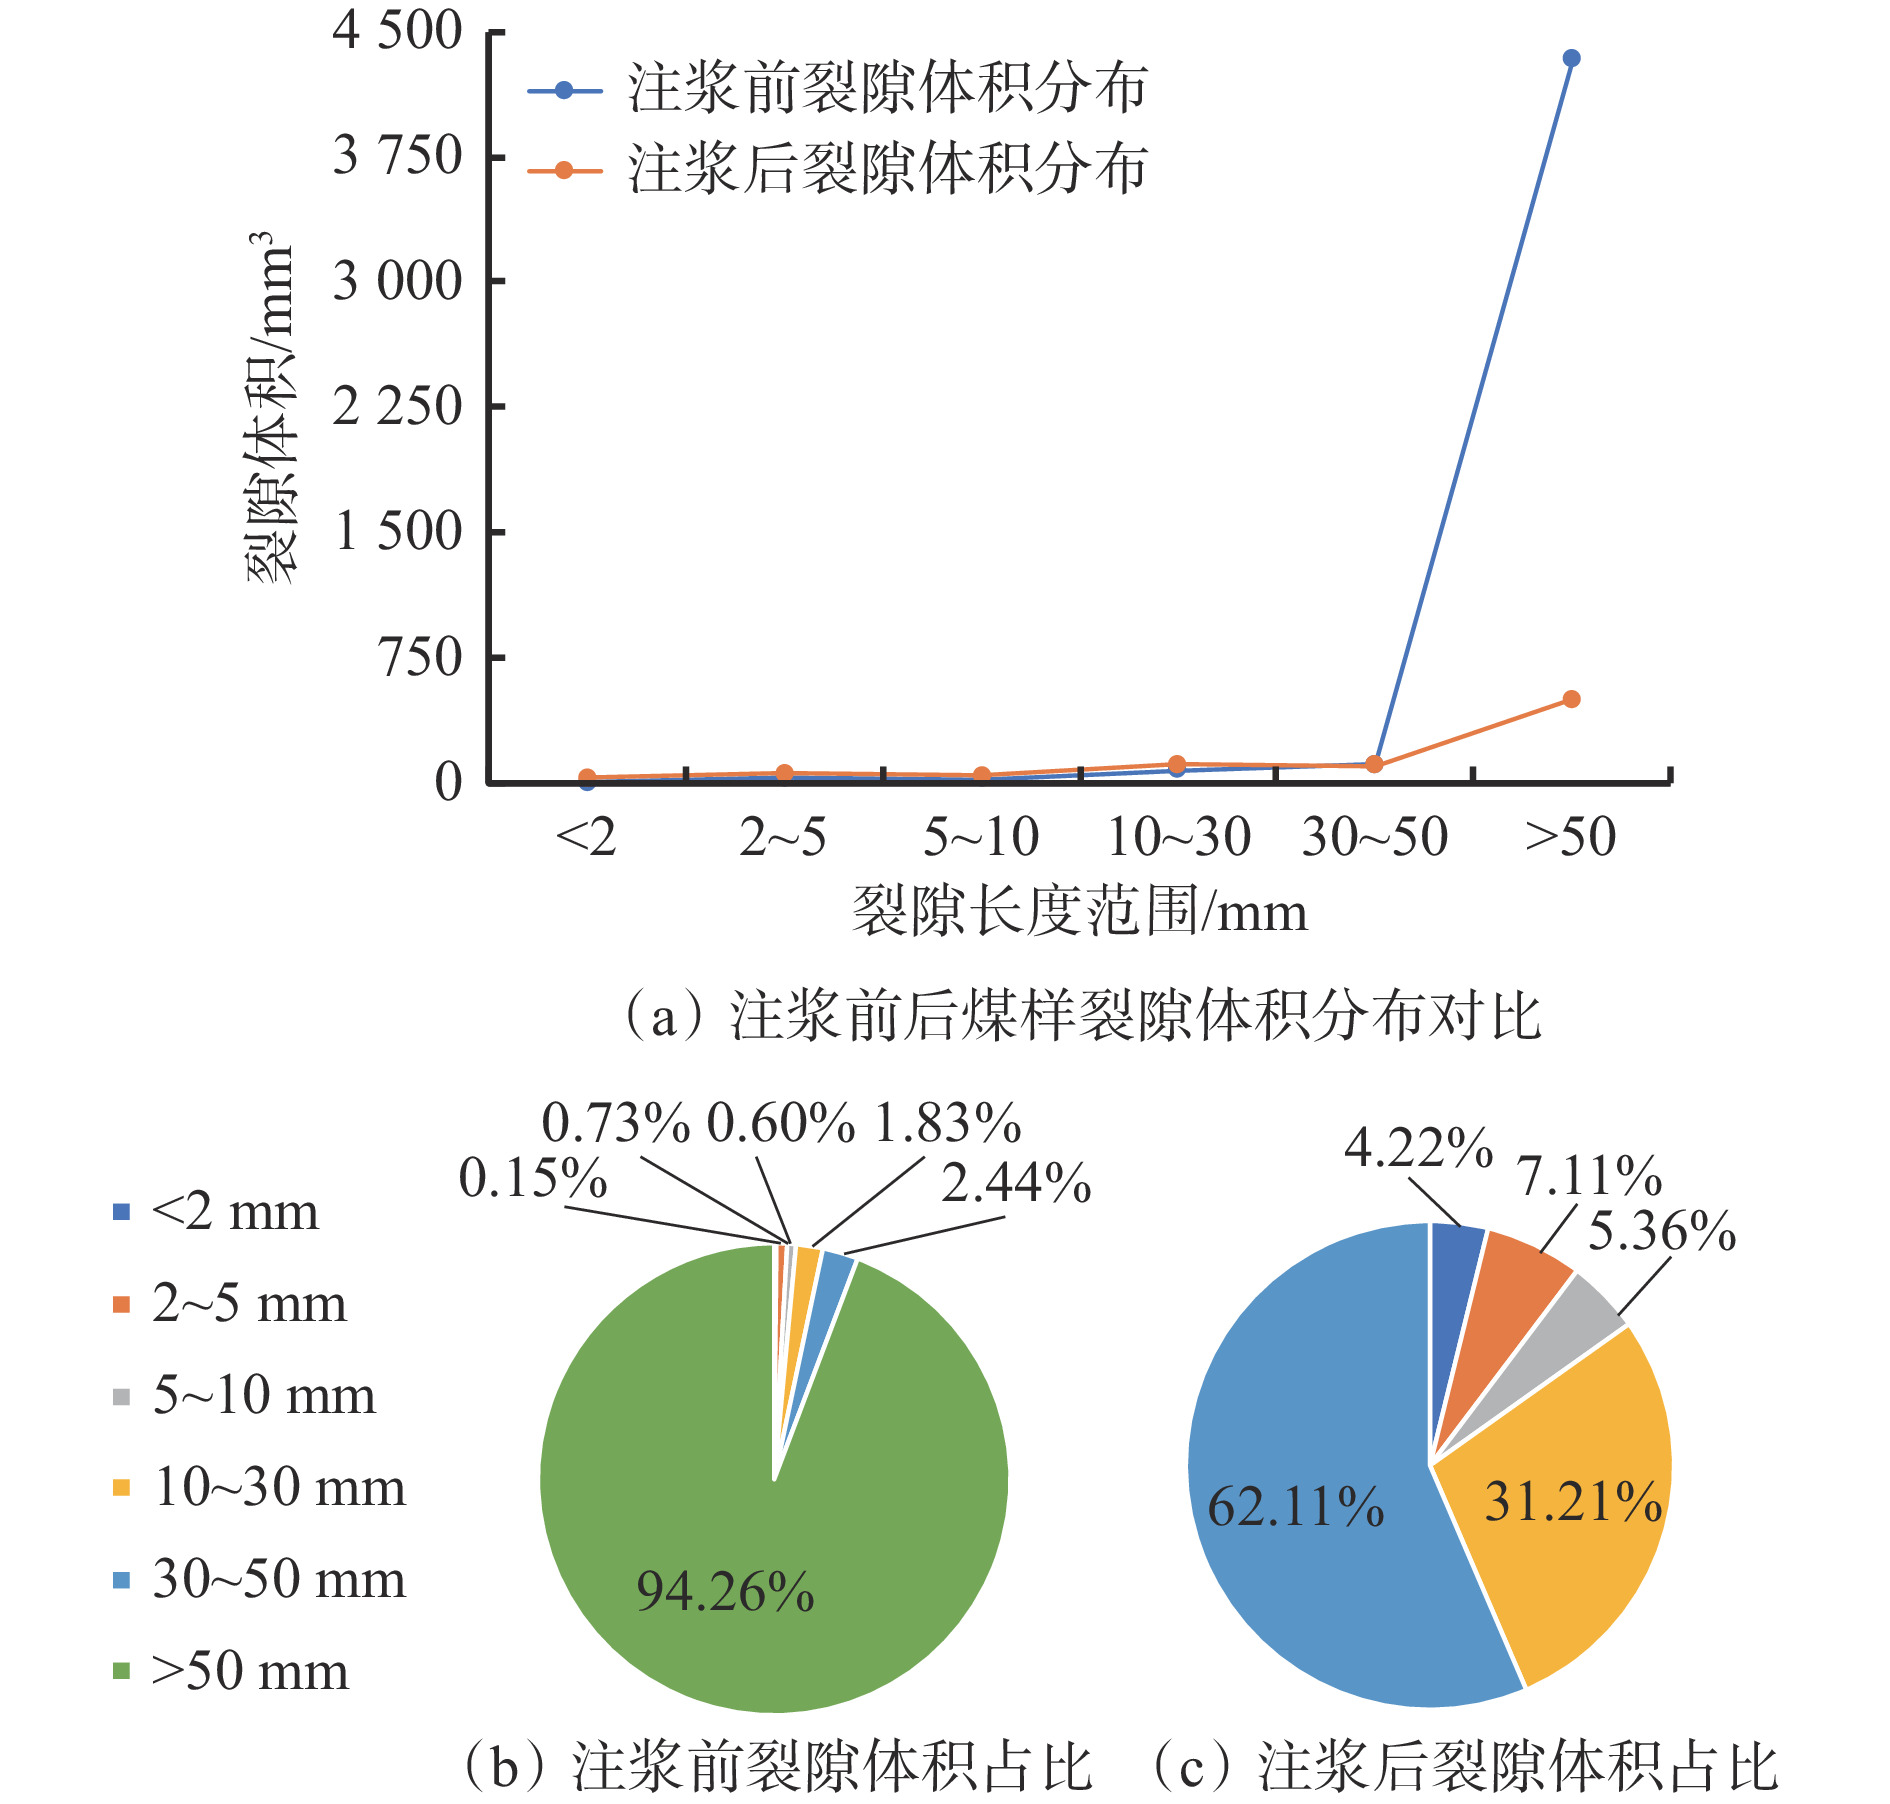
摘要: 针对现有注浆煤岩体裂隙结构和注浆效果研究不能定量表征的问题,利用自主搭建的受载煤岩体注浆试验系统开展了不同受载破裂煤样(单轴和劈裂)的注浆试验,采用工业CT扫描设备对破裂煤样注浆前后的裂隙结构进行了CT扫描,应用图像分析软件VG Studio MAX对CT扫描数据重建模型所得到的数字煤样进行裂隙精准提取,对受载破裂煤样注浆前后三维裂隙形态和结构进行了数字化定量分析。结果表明:① 单轴加载破裂煤样主裂隙由煤样顶部两侧贯穿至煤样底部并汇聚,裂隙宽度基本保持不变,煤样主要在剪切应力作用下破裂,整体破碎程度较大,主裂隙网络伴生较多的小裂隙;注浆前后50 mm以上裂隙由1条转为0,总裂隙体积由12 000 mm3减小为5 700 mm3,降幅为52.5%,表明单轴破裂煤样裂隙结构相对不利于浆液扩散流动。劈裂破坏煤样主裂隙由顶部沿竖直方向向下延伸至煤样中下部,裂隙宽度较大,然后向一方倾斜45°继续延伸,裂隙宽度逐渐变小;注浆前后50 mm以上裂隙由2条转为0,总裂隙体积由3 430 mm3减小为312 mm3,降幅为90.9%,表明劈裂破坏煤样裂隙结构有利于浆液的流动和充填。② 注浆前后单轴加载破裂煤样渗透率由57×10−14 m2下降到1.2×10⁻¹⁴ m2,下降了97.9%;注浆前后劈裂破坏煤样渗透率由75×10−14 m2下降到1.3×10⁻¹⁴ m2,下降了98.3%,表明注浆对不同破坏形式煤样均具有显著的堵漏降渗效果。 ③ 对比2种煤样注浆前后裂隙体积和渗透率变化情况可以看出,虽然单轴加载破裂煤样注浆浆液仅充填了部分裂隙,但渗透率与原始煤样差别很小,表明通过阻隔漏气通道的连通性,即可有效封堵裂隙并取得良好的注浆封孔效果。研究结果可为破裂煤体注浆量化分析及煤层注浆封堵效果评价提供有益参考。Abstract: The existing research on the fracture structure and grouting effect of grouting coal and rock mass cannot be quantitatively characterized. In order to solve the problem, the self-built grouting test system for loaded coal and rock mass is used to carry out the grouting test of different loaded fractured coal samples(uniaxial and splitting). The CT scanning of the fractured coal sample before and after grouting are carried out by using industrial CT scanning equipment. The image analysis software VG Studio MAX is used to accurately extract the fractures of the digital coal sample obtained from CT scanning data reconstruction model. The digital quantitative analysis of the three-dimensional fracture morphology and structure of the loaded fractured coal samples before and after grouting is carried out. ① The results show that the main fracture of the fractured coal sample under uniaxial loading penetrates from both sides of the top of the coal sample to the bottom of the coal sample and converges. The fracture width is basically unchanged. The coal sample is mainly fractured under the action of shear stress. The overall degree of fragmentation is large. The main fracture network is accompanied by more small fractures. The number of fracture above 50 mm is changed from 1 before grouting to 0 after grouting. The total fracture volume is reduced from 12 000 mm3 to 5 700 mm3 by 52.5%. It shows that the fracture structure of fractured coal sample under uniaxial loading is not conducive to slurry diffusion flow. The main fracture of splitting failure coal sample extends downward from the top to the middle and lower part of the coal sample along the vertical direction. The fracture width is large. And then the fracture tilts 45° to one side and continues to extend. The fracture width gradually narrows. The number of fractures above 50 mm is changed from 2 before grouting to 0 after grouting. The total fracture volume is reduced from 3 430 mm3 to 312 mm3 by 90.9%. It shows that the fracture structure of splitting failure coal sample is conducive to the flow and filling of slurry. ② The permeability of fractured coal sample under uniaxial loading is decreased from 57×10−14 m2 before grouting to 1.2×10⁻¹⁴ m2 after grouting by 97.9%. The permeability of splitting failure coal sample is decreased from 75×10−14 m2 before grouting to 1.3×10⁻¹⁴ m2 after grouting by 98.3%. It shows that grouting has a significant effect of plugging leakage and reducing seepage on coal sample with different failure forms. ③ The change of fracture volume and permeability of two kinds of coal samples before and after grouting are compared. It shows that although the grouting slurry of fractured coal sample under uniaxial loading only fills part of the fracture, the permeability difference is very small compared with the original coal sample. This result indicates that by blocking the connectivity of the air leakage channel, the fractures can be effectively blocked and a good grouting hole sealing effect is achieved. The research results can provide useful references for quantitative analysis of grouting in fractured coal and evaluation of grouting plugging effect in coal seam.
-
0. 引言
钢丝绳具有弯曲性能好、承载能力强、质量轻和结构多样性等优点,被广泛应用于矿井牵引和承载工作中[1]。钢丝绳作为牵引和承载设备的关键构件,在长期作业过程中会受到腐蚀、冲击等影响,再加上处于承力、弯曲等工作状态,会出现断丝、锈蚀等损伤[2-3]。断丝是在役钢丝绳常见的损伤类型,钢丝绳产生断丝后,剩余强度降低,削弱其承载能力,严重时可导致钢丝绳断裂,出现极大的安全隐患[4-6]。为确保钢丝绳安全服役,各行业制定了相应的钢丝绳报废定量标准,其中钢丝绳断丝数量是评判钢丝绳是否报废的主要指标[7-8]。漏磁检测因其原理简单、实施成本较低、检测效果好,成为目前钢丝绳无损检测最主要的方法之一[9-11]。现场漏磁检测时将钢丝绳置于检测仪器中,通过移动钢丝绳或检测仪器进行扫描检测[12],分析检测到的漏磁场,从而了解钢丝绳损伤状态,及时更换达到报废标准的钢丝绳,确保钢丝绳安全运行。
为建立断丝与漏磁场的定量关系,需通过理论计算方法分析钢丝绳断丝漏磁场分布规律。理论计算钢丝绳断丝漏磁场的方法分为解析法和数值法。解析法通过简化钢丝损伤模型建立等效磁偶极子模型,该模型最早用来模拟点状缺陷和裂纹的漏磁场[13-15]。K. Seleznyova等[16]建立了3种不同的磁偶极子模型,实现了磁偶极子模型的磁力线可视化。窦连城等[17]采用二维磁荷模型对钢丝绳断丝漏磁场进行分析,得出钢丝绳断丝轴向漏磁场计算公式与磁场分布形态。解析法能够精确地计算出漏磁场,但在计算钢丝绳绳股漏磁场时存在困难。数值法是利用麦克斯韦方程组分析漏磁场参数变化,且利用有限元分析钢丝绳缺陷漏磁场的数值法研究较为完善。李登蓬[18]使用有限元仿真软件建立了二维静态磁场仿真模型,对磁回路的磁化状态进行分析,验证了钢丝绳的磁化饱和状态。郭永亮[19]通过建立钢丝绳二维动态磁场仿真模型,研究钢丝绳绳股漏磁场,证明了用直线运动对钢丝绳绳股漏磁场进行仿真的方法是可行的。朱良[20]使用三维静态磁场仿真模型分析了断口参数变化对漏磁场的影响。目前钢丝绳断丝漏磁场分布规律的仿真研究主要使用有限元静态磁场仿真模型,该模型中钢丝绳与损伤检测仪器是相对静止的,而现场钢丝绳损伤检测过程中钢丝绳与损伤检测仪器之间有相对运动,因此静态磁场仿真漏磁场和实际检测获得的漏磁场存在偏差。
为准确仿真钢丝绳与损伤检测仪器相对运动状态下的漏磁场,本文使用Ansoft Maxwell电磁仿真软件,基于漏磁无损检测原理,建立钢丝绳三维动态磁场仿真模型,分析不同断口宽度、断丝数量和提离值下断丝轴向漏磁场分布规律。
1. 钢丝绳漏磁无损检测原理和漏磁场特征定义
钢丝绳漏磁无损检测原理如图1所示。使用永磁体将钢丝绳磁化至饱和,钢丝绳与气隙、永磁体、衔铁形成磁回路,钢丝绳出现断丝等损伤时,断口位置的磁阻会增大,有一部分磁通量泄漏至空气中形成漏磁场。使用霍尔元件等磁敏元件检测漏磁场,实现钢丝绳损伤状态的识别[21]。
![]() 图 1 钢丝绳漏磁无损检测原理Figure 1. Principle of magnetic flux leakage(MFL) non-destructive testing of wire rope
图 1 钢丝绳漏磁无损检测原理Figure 1. Principle of magnetic flux leakage(MFL) non-destructive testing of wire rope钢丝绳轴向漏磁场磁感应强度如图2所示。中间位置为钢丝绳断丝轴向漏磁场,Pz为钢丝绳断丝轴向漏磁场峰峰值,两侧类正弦波为钢丝绳绳股漏磁场。
![]() 图 2 钢丝绳轴向漏磁场磁感应强度Figure 2. Magnetic induction intensity of axial leakage magnetic field in wire rope
图 2 钢丝绳轴向漏磁场磁感应强度Figure 2. Magnetic induction intensity of axial leakage magnetic field in wire rope2. 基于三维动态磁场仿真模型的钢丝绳断丝漏磁场分析
Ansoft Maxwell软件可通过设置模型的尺寸、结构和材料电磁属性,仿真分析二维/三维模型的静态磁场或动态磁场,根据钢丝绳漏磁无损检测原理,提取待检测位置仿真漏磁场[22]。
Ansoft Maxwell依据麦克斯韦方程组进行仿真计算:
$$ \left\{\begin{array}{l} \nabla\cdot {\boldsymbol{D}}={\rho }_{0}\\ \nabla \times {\boldsymbol{E}}=-\dfrac{\partial {\boldsymbol{B}}}{\partial t}\\ \nabla\cdot {\boldsymbol{B}}=0\\ \nabla \times {\boldsymbol{H}}={{\boldsymbol{j}}}_{0}+\dfrac{\partial {\boldsymbol{D}}}{\partial t}\end{array}\right. $$ (1) 式中:$ \nabla $为矢量微分算子;D为电位移;$ {\rho }_{0} $为自由电荷密度;E为电场强度;B为磁感应强度;H为磁场强度;$ {{\boldsymbol{j}}}_{0} $为传导电流密度;$ t $为时间。
静态磁场仿真中模型是静止的,只能仿真模型单一时间节点的磁场状态;动态磁场仿真可以通过设置部分模型的运动速度和方向仿真模型运动时间内任意时间节点的瞬时磁场状态。动态磁场仿真相较于静态磁场仿真,其仿真结果含有断丝漏磁场和钢丝绳绳股漏磁场,更接近实际情况下钢丝绳漏磁信号,因此使用动态磁场仿真钢丝绳断丝漏磁场。
三维动态磁场仿真模型包括钢丝绳模型和励磁结构模型。根据6×37+FC的钢丝绳结构建立简化钢丝绳模型,模型直径为43 mm,断丝设置在钢丝绳中间位置表面,使用与钢丝绳绳股旋向相同的矩形凹槽表示断丝情况,不同断丝参数设置见表1。
表 1 不同断丝参数设置Table 1. Settings for different broken strands parameters断丝数量/根 断丝截面长度/mm 断丝深度/mm 1 2 2 2 4 2 3 6 2 4 8 2 励磁结构模型由永磁体和衔铁组成,如图3所示,采用1对径向充磁的环形永磁体进行励磁,永磁体材料为钕铁硼,磁铁之间的导磁部件为衔铁,材料为工业纯铁,其余部分设置为空气。
励磁结构模型轴线与钢丝绳模型轴线重合,励磁结构模型保持不动,钢丝绳模型沿轴线移动,从运动初始位置开始移动,经过励磁结构模型中心位置,最后移动到运动结束位置,总运动时间为50 s,初始位置和结束位置关于励磁结构模型中心对称,如图4所示。
基于漏磁无损检测原理,为使磁化钢丝绳断丝后的漏磁场易于检测与分辨,需要将钢丝绳磁化至饱和状态且磁化均匀。绘制钢丝绳磁通量密度云图(图5),判断钢丝绳的磁化状态和磁通分布。
从图5可看出,钢丝绳断丝周边已被均匀磁化,断丝断口端面处相对于断口周围位置的磁通量密度偏小,这是由于断丝断口断面处的空气磁阻远大于钢丝绳,阻碍了磁力线的通过。
以下分析不同因素对断丝漏磁场的影响。
1) 断口宽度对断丝漏磁场的影响分析。设置断丝断口宽度分别为3,5,7,10,13,15 mm,提取断丝上方5 mm处轴向漏磁场进行分析。通过三维动态磁场仿真模型得到的不同断口宽度下断丝轴向漏磁场磁感应强度及漏磁场峰峰值分别如图6和图7所示。可看出三维动态磁场仿真计算的漏磁场中包含断丝漏磁场和钢丝绳绳股漏磁场;在4种断丝数量情况下,随着断口宽度增加,断丝轴向漏磁场峰峰值均呈先增大后减小的趋势,且峰峰值在断口宽度为7,10 mm处开始减小。
![]() 图 6 通过三维动态磁场仿真模型得到的不同断口宽度下断丝轴向漏磁场磁感应强度Figure 6. Magnetic induction intensity of axial leakage magnetic field at different fracture widths of broken strands obtained from the three-dimensional dynamic magnetic field simulation model
图 6 通过三维动态磁场仿真模型得到的不同断口宽度下断丝轴向漏磁场磁感应强度Figure 6. Magnetic induction intensity of axial leakage magnetic field at different fracture widths of broken strands obtained from the three-dimensional dynamic magnetic field simulation model![]() 图 7 通过三维动态磁场仿真模型得到的断丝轴向漏磁场峰峰值随断口宽度变化规律Figure 7. Variation patteen of peak-to-peak value of axial leakage magnetic field with fracture widths of broken strands obtained from three-dimensional dynamic magnetic field simulation model
图 7 通过三维动态磁场仿真模型得到的断丝轴向漏磁场峰峰值随断口宽度变化规律Figure 7. Variation patteen of peak-to-peak value of axial leakage magnetic field with fracture widths of broken strands obtained from three-dimensional dynamic magnetic field simulation model2) 不同断丝数量对断丝漏磁场的影响分析。设置断丝数量分别为1,2,3,4根,提取断丝上方5 mm处轴向漏磁场进行分析。通过三维动态磁场仿真模型得到的不同断丝数量下断丝轴向漏磁场磁感应强度及漏磁场峰峰值分别如图8和图9所示。可看出在6种断口宽度情况下,断丝轴向漏磁场峰峰值均随着断丝数量的增加而增大。
![]() 图 8 通过三维动态磁场仿真模型得到的不同断丝数量下轴向漏磁场磁感应强度Figure 8. Magnetic induction intensity of axial leakage field under different number of broken wires obtained by three-dimensional dynamic magnetic field simulation model
图 8 通过三维动态磁场仿真模型得到的不同断丝数量下轴向漏磁场磁感应强度Figure 8. Magnetic induction intensity of axial leakage field under different number of broken wires obtained by three-dimensional dynamic magnetic field simulation model![]() 图 9 通过三维动态磁场仿真模型得到的断丝轴向漏磁场峰峰值随断丝数量变化规律Figure 9. Peak-peak value variation law of axial leakage magnetic field with the number of broken wires obtained by three-dimensional dynamic magnetic field simulation model
图 9 通过三维动态磁场仿真模型得到的断丝轴向漏磁场峰峰值随断丝数量变化规律Figure 9. Peak-peak value variation law of axial leakage magnetic field with the number of broken wires obtained by three-dimensional dynamic magnetic field simulation model3) 提离值对断丝漏磁场的影响分析。定义霍尔元件与钢丝绳表面之间的距离为提离值。设置钢丝绳断丝数量为3根、断口宽度为10 mm,提取断丝上方1~10 mm处轴向漏磁场进行分析。通过三维动态磁场仿真模型得到的不同提离值下断丝轴向漏磁场磁感应强度及漏磁场峰峰值分别如图10和图11所示。可看出断丝轴向漏磁场峰峰值随着提离值的增加而减小。
![]() 图 10 通过三维动态磁场仿真模型得到的不同提离值下轴向漏磁场磁感应强度Figure 10. Magnetic induction intensity of axial leakage field under different lifting values obtained by three-dimensional dynamic magnetic field simulation model
图 10 通过三维动态磁场仿真模型得到的不同提离值下轴向漏磁场磁感应强度Figure 10. Magnetic induction intensity of axial leakage field under different lifting values obtained by three-dimensional dynamic magnetic field simulation model![]() 图 11 通过三维动态磁场仿真模型得到的断丝轴向漏磁场峰峰值随提离值变化规律Figure 11. Peak-peak value variation law of axial leakage magnetic field with lifting values obtained by three-dimensional dynamic magnetic field simulation model
图 11 通过三维动态磁场仿真模型得到的断丝轴向漏磁场峰峰值随提离值变化规律Figure 11. Peak-peak value variation law of axial leakage magnetic field with lifting values obtained by three-dimensional dynamic magnetic field simulation model3. 基于三维磁偶极子模型的钢丝绳断丝漏磁场验证分析
为验证三维动态磁场仿真模型仿真结果的正确性,构建常用于钢丝绳断丝漏磁场分析的三维磁偶极子模型,如图12所示。
设定模型轴线中点o为原点,模型轴线方向为y轴,模型横截面内x轴和z轴正交,建立笛卡尔坐标系。用磁荷+Q和−Q产生的磁场代替钢丝绳两侧断面磁场,这2个磁场关于原点o对称。断面到原点o的距离为l,断口宽度为2l,磁荷+Q和−Q的坐标分别为($ {x}_{1},l,{z}_{1} $)和($ {x}_{1},-l,{z}_{1} $)。P为空间任一点,其坐标为($ {x}_{P} $,$ {y}_{P} $,$ {z}_{P} $),磁荷+Q和−Q到P点的磁场矢量分别为$ {{\boldsymbol{r}}_{1}} $和$ {{{\boldsymbol{r}}}_{2}} $,根据磁场库仑定律,+Q在P点处产生的磁场强度$ {{\boldsymbol{H}}}_{+Q} $和−Q在P点处产生的磁场强度$ {{\boldsymbol{H}}}_{-Q} $分别为
$$ {{\boldsymbol{H}}}_{+Q}=\dfrac{{q}_{1}{{\boldsymbol{ r}}}_{1}}{4{\text{π}} {\mu }_{0}{\left|{{\boldsymbol{ r}}}_{1}\right|}^{3}} $$ (2) $${{\boldsymbol{H}}}_{-Q}=\dfrac{{q}_{1}{{\boldsymbol{r}}}_{2}}{4{\text{π}} {\mu }_{0}{\left|{{\boldsymbol{r}}}_{2}\right|}^{3}} $$ (3) 式中:$ {q}_{1} $为两磁荷的磁荷量;$ {\mu }_{0} $为真空环境的磁导率。
根据磁场叠加原理,P点处磁场强度为
$$ {{\boldsymbol{H}}}_{{{P}}}={{\boldsymbol{H}}}_{+Q}+{{\boldsymbol{H}}}_{-Q}=\frac{{q}_{1}{ {\boldsymbol{r}}}_{1}}{4{\text{π}} {\mu }_{0}{\left|{{\boldsymbol{r}}}_{1}\right|}^{3}}+\frac{{q}_{1}{{\boldsymbol{r}}}_{2}}{4{\text{π}} {\mu }_{0}{\left|{{\boldsymbol{r}}}_{2}\right|}^{3}} $$ (4) 真空环境的磁导率定义为磁感应强度B与磁场强度H的比值,则
$$ {\boldsymbol{B}}={\mu }_{0}{\boldsymbol{H}} $$ (5) 结合式(4)和式(5),得到P点处磁感应强度:
$$ \boldsymbol{B}_{\mathrm{P}}=\boldsymbol{B}_{+Q}+\boldsymbol{B}_{-Q}=\frac{q_1\boldsymbol{r}_1}{4\text{π}\left|\boldsymbol{r}_1\right|^3}+\frac{q_1\boldsymbol{r}_2}{4\text{π}\left|\boldsymbol{r}_2\right|^3} $$ (6) 单根断丝时,P点处轴向磁感应强度分量为
$$ \begin{split} {B}_{P\mathrm{s}}=&\frac{{q}_{1}}{4{\text{π}} }\left\{\frac{{y}_{P}+l}{\left[\right({x}_{P}-{x}_{1}{)}^{2}+({y}_{P}+l{)}^{2}+({z}_{P}-{z}_{1}{)}^{2}{]}^{\tfrac{3}{2}}}\right.-\\ &\left.\frac{{y}_{h}-l}{\left[\right({x}_{P}-{x}_{1}{)}^{2}+({y}_{P}-l{)}^{2}+({z}_{P}-{z}_{1}{)}^{2}{]}^{\tfrac{3}{2}}}\right\} \end{split} $$ (7) 多根断丝时,P点处轴向磁感应强度分量可看作多对磁荷磁场的叠加,即
$$\begin{split} {B}_{P\mathrm{m}}=&\sum _{i=1}^{n}\frac{{q}_{i}}{4{\text{π}} }\left\{\frac{{y}_{P}+l}{\left[\right({x}_{P}-{x}_{i}{)}^{2}+({y}_{P}+l{)}^{2}+({z}_{P}-{z}_{i}{)}^{2}{]}^{\tfrac{3}{2}}}\right.-\\ &\left.\frac{{y}_{P}-l}{\left[\right({x}_{P}-{x}_{i}{)}^{2}+({y}_{P}-l{)}^{2}+({z}_{P}-{z}_{i}{)}^{2}{]}^{\tfrac{3}{2}}}\right\} \end{split} $$ (8) 式中:$ {x}_{i} $和$ {z}_{i} $为第i处断丝时磁荷在x轴和z轴的坐标;n为断丝数量。
通过三维磁偶极子模型得到的钢丝绳断丝轴向漏磁场磁感应强度如图13所示。
![]() 图 13 通过三维磁偶极子模型得到的断丝轴向漏磁场磁感应强度Figure 13. Magnetic induction intensity of axial leakage field of broken wire obtained by three-dimensional magnetic dipole model
图 13 通过三维磁偶极子模型得到的断丝轴向漏磁场磁感应强度Figure 13. Magnetic induction intensity of axial leakage field of broken wire obtained by three-dimensional magnetic dipole model1) 不同断口宽度下断丝漏磁场验证分析。设置断丝断口宽度为1~20 mm,变化步长为1 mm,提取断丝上方5 mm处轴向漏磁场进行分析。通过三维磁偶极子模型得到的不同断口宽度下断丝轴向漏磁场峰峰值如图14所示。可看出在4种断丝情况下,随着断口宽度的增加,通过三维磁偶极子模型计算的断丝轴向漏磁场峰峰值均呈先增大后减小的趋势,且峰峰值在断口宽度为8,9 mm处开始减小。
![]() 图 14 通过三维磁偶极子模型得到的断丝轴向漏磁场峰峰值随断口宽度变化规律Figure 14. Peak-peak value variation law of axial leakage magnetic field with fracture widths obtained by three-dimensional magnetic dipole model
图 14 通过三维磁偶极子模型得到的断丝轴向漏磁场峰峰值随断口宽度变化规律Figure 14. Peak-peak value variation law of axial leakage magnetic field with fracture widths obtained by three-dimensional magnetic dipole model2) 不同断丝数量下断丝漏磁场验证分析。设置断丝数量分别为1,2,3,4根,提取断丝上方5 mm处轴向漏磁场进行分析。通过三维磁偶极子模型得到的不同断丝数量下断丝轴向漏磁场峰峰值如图15所示。可看出在20种断口宽度情况下,通过三维磁偶极子模型计算的断丝轴向漏磁场峰峰值均随着断丝数量的增加而增大。
![]() 图 15 通过三维磁偶极子模型得到的断丝轴向漏磁场峰峰值随断丝数量变化规律Figure 15. Peak-peak value variation law of axial leakage magnetic field with the number of broken wires obtained by three-dimensional magnetic dipole model
图 15 通过三维磁偶极子模型得到的断丝轴向漏磁场峰峰值随断丝数量变化规律Figure 15. Peak-peak value variation law of axial leakage magnetic field with the number of broken wires obtained by three-dimensional magnetic dipole model3) 不同提离值下断丝漏磁场验证分析。设置钢丝绳断丝数量为3根、断口宽度为10 mm,提取断丝上方1~10 mm处轴向漏磁场进行分析。通过三维磁偶极子模型得到的不同提离值下断丝轴向漏磁场峰峰值如图16所示。可看出通过三维磁偶极子模型计算的断丝轴向漏磁场峰峰值随着提离值的增加而减小。
![]() 图 16 通过三维磁偶极子模型得到的断丝轴向漏磁场峰峰值随提离值变化规律Figure 16. Peak-peak value variation law of axial leakage magnetic field with lifting values obtained by three-dimensional magnetic dipole model
图 16 通过三维磁偶极子模型得到的断丝轴向漏磁场峰峰值随提离值变化规律Figure 16. Peak-peak value variation law of axial leakage magnetic field with lifting values obtained by three-dimensional magnetic dipole model由上述分析可知,通过三维磁偶极子模型得到的断丝轴向漏磁场峰峰值随断口宽度、断丝数量、提离值变化规律与通过三维动态磁场仿真模型得到的变化规律相同,验证了三维动态磁场仿真模型的正确性。
4. 结论
1) 三维动态磁场仿真模型可以模拟损伤检测仪器与钢丝绳间的相对运动状态,其计算的漏磁场含有断丝漏磁场和钢丝绳绳股漏磁场,更接近实际漏磁场。
2) 断丝轴向漏磁场峰峰值随着断口宽度的增加呈先增大后减小的趋势,随着断丝数量的增加而增大,随着提离值的增加而减小。
-
![]()
图 3 单轴加载破裂煤样裂隙结构
Figure 3. Fracture structure of fractured coal samples under uniaxial loading
![]()
图 5 单轴加载破裂煤样注浆后裂隙结构
Figure 5. Fracture structure of fractured coal samples under uniaxial loading after grouting
![]()
图 6 劈裂破坏煤样注浆后裂隙结构
Figure 6. Fracture structure of splitting failure coal samples after grouting
![]()
图 7 单轴破裂煤样注浆前后裂隙数量占比
Figure 7. Fracture number ratio of fractured coal samples under uniaxial loading before and after grouting
![]()
图 8 单轴破裂煤样注浆前后裂隙体积占比
Figure 8. Fracture volume ratio of fractured coal samples under uniaxial loading before and after grouting
![]()
图 9 劈裂破坏煤样注浆前后裂隙数量占比
Figure 9. Fracture number ratio of splitting failure coal samples before and after grouting
![]()
图 10 劈裂破坏煤样注浆前后裂隙体积占比
Figure 10. Fracture volume ratio of splitting failure coal samples before and after grouting
表 1 试验煤样工业分析参数
Table 1 Industrial analysis parameters of test coal samples %
煤样编号 水分 灰分 挥发分 煤样1 1.28 8.63 7.60 煤样2 1.72 7.49 7.37  下载: 导出CSV
表 2 煤样注浆前后基本数据对比
Table 2 Comparison of coal sample basic data before and after grouting
煤样
破坏注浆前
质量/g注浆后
质量/g原煤渗透
率/10−14 m2受载破裂渗
透率/10−14 m2注浆后渗透
率/10−14 m2劈裂 289 305 1.1 75 1.3 单轴 295 308 0.8 57 1.2
下载: 导出CSV
-
[1] 谢和平,吴立新,郑德志. 2025年中国能源消费及煤炭需求预测[J]. 煤炭学报,2019,44(7):1949-1960. XIE Heping,WU Lixin,ZHENG Dezhi. Prediction on the energy consumption and coal demand of China in 2025[J]. Journal of China Coal Society,2019,44(7):1949-1960.
[2] 张宏图,李阳,姚邦华,等. 瓦斯抽采钻孔封孔水泥砂浆黏度时变性扩散模型[J]. 煤炭科学技术,2020,48(10):52-59. ZHANG Hongtu,LI Yang,YAO Banghua,et al. Time-dependent viscosity diffusion model of cement mortar grouting for gas drainage borehole sealing[J]. Coal Science and Technology,2020,48(10):52-59.
[3] 周福宝,孙玉宁,李海鉴,等. 煤层瓦斯抽采钻孔密封理论模型与工程技术研究[J]. 中国矿业大学学报,2016,45(3):433-439. ZHOU Fubao,SUN Yuning,LI Haijian,et al. Research on the theoretical model and engineering technology of the coal seam gas drainage hole sealing[J]. Journal of China University of Mining & Technology,2016,45(3):433-439.
[4] 柳昭星,靳德武,尚宏波,等. 矿区岩溶裂隙岩体帷幕截流注浆参数确定研究[J]. 煤炭科学技术,2019,47(6 ):81-86. LIU Zhaoxing,JIN Dewu,SHANG Hongbo,et al. Study on determination of curtain closure grouting parameters of fractured rock mass in karst mining area[J]. Coal Science and Technology,2019,47(6 ):81-86.
[5] LIU Xiaofan,WANG Junguang,HUANG Kun,et al. Experimental study on dynamic water grouting of modified water-soluble polyurethane[J]. KSCE Journal of Civil Engineering,2019,23(11):3897-3906.
[6] ZHOU Zilong,DU Xueming,CHEN Zhao,et al. Grouting diffusion of chemical fluid flow in soil with fractal characteristics[J]. Journal of Central South University,2017,24(5):182-188.
[7] 于跃. 注浆加固煤体力学性质与渗透率试验研究[D]. 哈尔滨: 黑龙江科技大学, 2015. YU Yue. Experimental study on mechanical properties and permeability of coal with grouting reinforcement[D]. Harbin: Heilongjiang University of Science and Technology, 2015.
[8] 钱自卫,姜振泉,曹丽文,等. 弱胶结孔隙介质渗透注浆模型试验研究[J]. 岩土力学,2013,34(1):139-142,147. QIAN Ziwei,JIANG Zhenquan,CAO Liwen,et al. Experiment study of penetration grouting model for weakly cemented porous media[J]. Rock and Soil Mechanics,2013,34(1):139-142,147.
[9] 刘奇,陈卫忠,袁敬强,等. 基于渗流−侵蚀理论的岩溶充填介质注浆加固效果评价[J]. 岩石力学与工程学报,2020,39(3):1-9. LIU Qi,CHEN Weizhong,YUAN Jingqiang,et al. Evaluation of grouting reinforcement effect for karst filling medium based on seepage-erosion theory[J]. Chinese Journal of Rock Mechanics and Engineering,2020,39(3):1-9.
[10] 郭东明,何天宇,杨仁树,等. 裂隙岩石试件超细水泥注浆效果CT分析[J]. 采矿与安全工程学报,2017,34(5):987-992. GUO Dongming,HE Tianyu,YANG Renshu,et al. CT analysis on micro-cement grouting effect for fractured rock sample[J]. Journal of Mining & Safety Engineering,2017,34(5):987-992.
[11] 魏建平,姚邦华,刘勇,等. 裂隙煤体注浆浆液扩散规律及变质量渗流模型研究[J]. 煤炭学报,2020,45(1):204-212. WEI Jianping,YAO Banghua,LIU Yong,et al. Grouting fluid diffusion law and variable mass seepage model for fractured coal[J]. Journal of China Coal Society,2020,45(1):204-212.
[12] 杨仁树,薛华俊,郭东明,等. 基于注浆试验的深井软岩CT分析[J]. 煤炭学报,2016,41(2):345-351. YANG Renshu,XUE Huajun,GUO Dongming,et al. Laboratory grouting experiment based CT analysis of grouted soft rocks in deep mines[J]. Journal of China Coal Society,2016,41(2):345-351.


计量
- 文章访问数: 165
- HTML全文浏览量: 41
- PDF下载量: 29
