

A method for detecting dust particles in excavation working face based on image analysis
-
摘要: 基于光散射原理测定粉尘质量浓度只能定时定点手动检测,实时性差,且只能检测出粉尘质量浓度,并不能给出粒径分布范围。目前基于图像分析的粉尘颗粒检测研究主要是针对粉尘质量浓度或粒径分布进行单方面研究,并不能实现粉尘质量浓度和粒径分布范围的同时检测。针对上述问题,提出了一种基于图像分析的掘进工作面粉尘颗粒检测方法,探究图像特征与粉尘质量浓度、粒径分布间的关系。通过粉尘样本收集及图像采集装置,采集粉尘颗粒图像并获取采集图像时的粉尘质量浓度。编写粉尘样本图像处理算法,提取图像的灰度特征、纹理特征、几何特征相关参数。对提取的图像特征与实测粉尘质量浓度进行相关性分析,选取相关性较大的图像特征作为参数建立回归数学模型。提取粉尘颗粒对象像素点个数,结合转换系数,基于几何当量等效面积径计算粉尘粒径大小及分布范围。实验结果表明:实测粉尘质量浓度与建立的图像特征多元非线性回归模型数学模型计算值间的平均相对误差为12.37%,标准实测粒径与几何当量等效面积径得到的粒径分布间的最大相对误差为8.63%,平均相对误差为6.37%,验证了基于图像特征的粉尘质量浓度回归数学模型和基于几何当量等效面积径分布数学模型的准确性。Abstract: Based on the principle of light scattering, measuring dust concentration can only be done manually at fixed times and locations, with poor real-time performance. It can only detect dust mass concentration and cannot provide a range of particle size distribution. At present, research on dust particle detection based on image analysis mainly focuses on unilateral research on dust mass concentration or particle size distribution. It cannot achieve simultaneous detection of dust mass concentration and particle size distribution range. In order to solve the above problems, a method for detecting dust particles in excavation working face based on image analysis is proposed. It explores the relationship between image features and dust mass concentration and particle size distribution. By using a dust sample collection and image acquisition device, dust particle images are collected and the dust mass concentration at the time of image acquisition is obtained. An image processing algorithm for dust samples, is developed to extract parameters related to grayscale features, texture features, and geometric features of the image. The correlation analysis between the extracted image features and the measured dust mass concentration is performed, and the image features with high correlation is selected as parameters to establish a regression mathematical model. The method extracts the number of pixels in the dust particle object. Combining with the conversion coefficient, the method calculates the size and distribution range of the dust particle based on the geometric equivalent area diameter. The experimental results show that the average relative error between the measured dust mass concentration and the calculated values of the established image feature multiple nonlinear regression model mathematical model is 12.37%. The maximum relative error between the standard measured particle size and the geometric equivalent area size obtained from the particle size distribution is 8.63%, and the average relative error is 6.37%. This verifies the accuracy of the image feature based dust mass concentration regression mathematical model and the geometric equivalent area diameter distribution mathematical model.
-

图 9 粉尘样本像素数量与整体图像像素数量的比值特征曲线
Figure 9. Ratio feature curve between the number of pixels in dust samples and the number of pixels in the overall image

图 10 图像采集时实测粉尘质量浓度
Figure 10. Actual dust concentration at the time of image acquisition

图 11 粉尘样本的粒径区间分布及占比
Figure 11. Distribution and proportion of particle size intervals in dust samples

图 12 粉尘质量浓度及粒径分布实验平台
Figure 12. Dust concentration and particle size distribution test platform

图 13 实测粒径分布与图像分析对比
Figure 13. Comparison between measured dust concentration and image analysis
表 1 特征参数与实测粉尘质量浓度
Table 1. Feature parameters and actual dust concentration
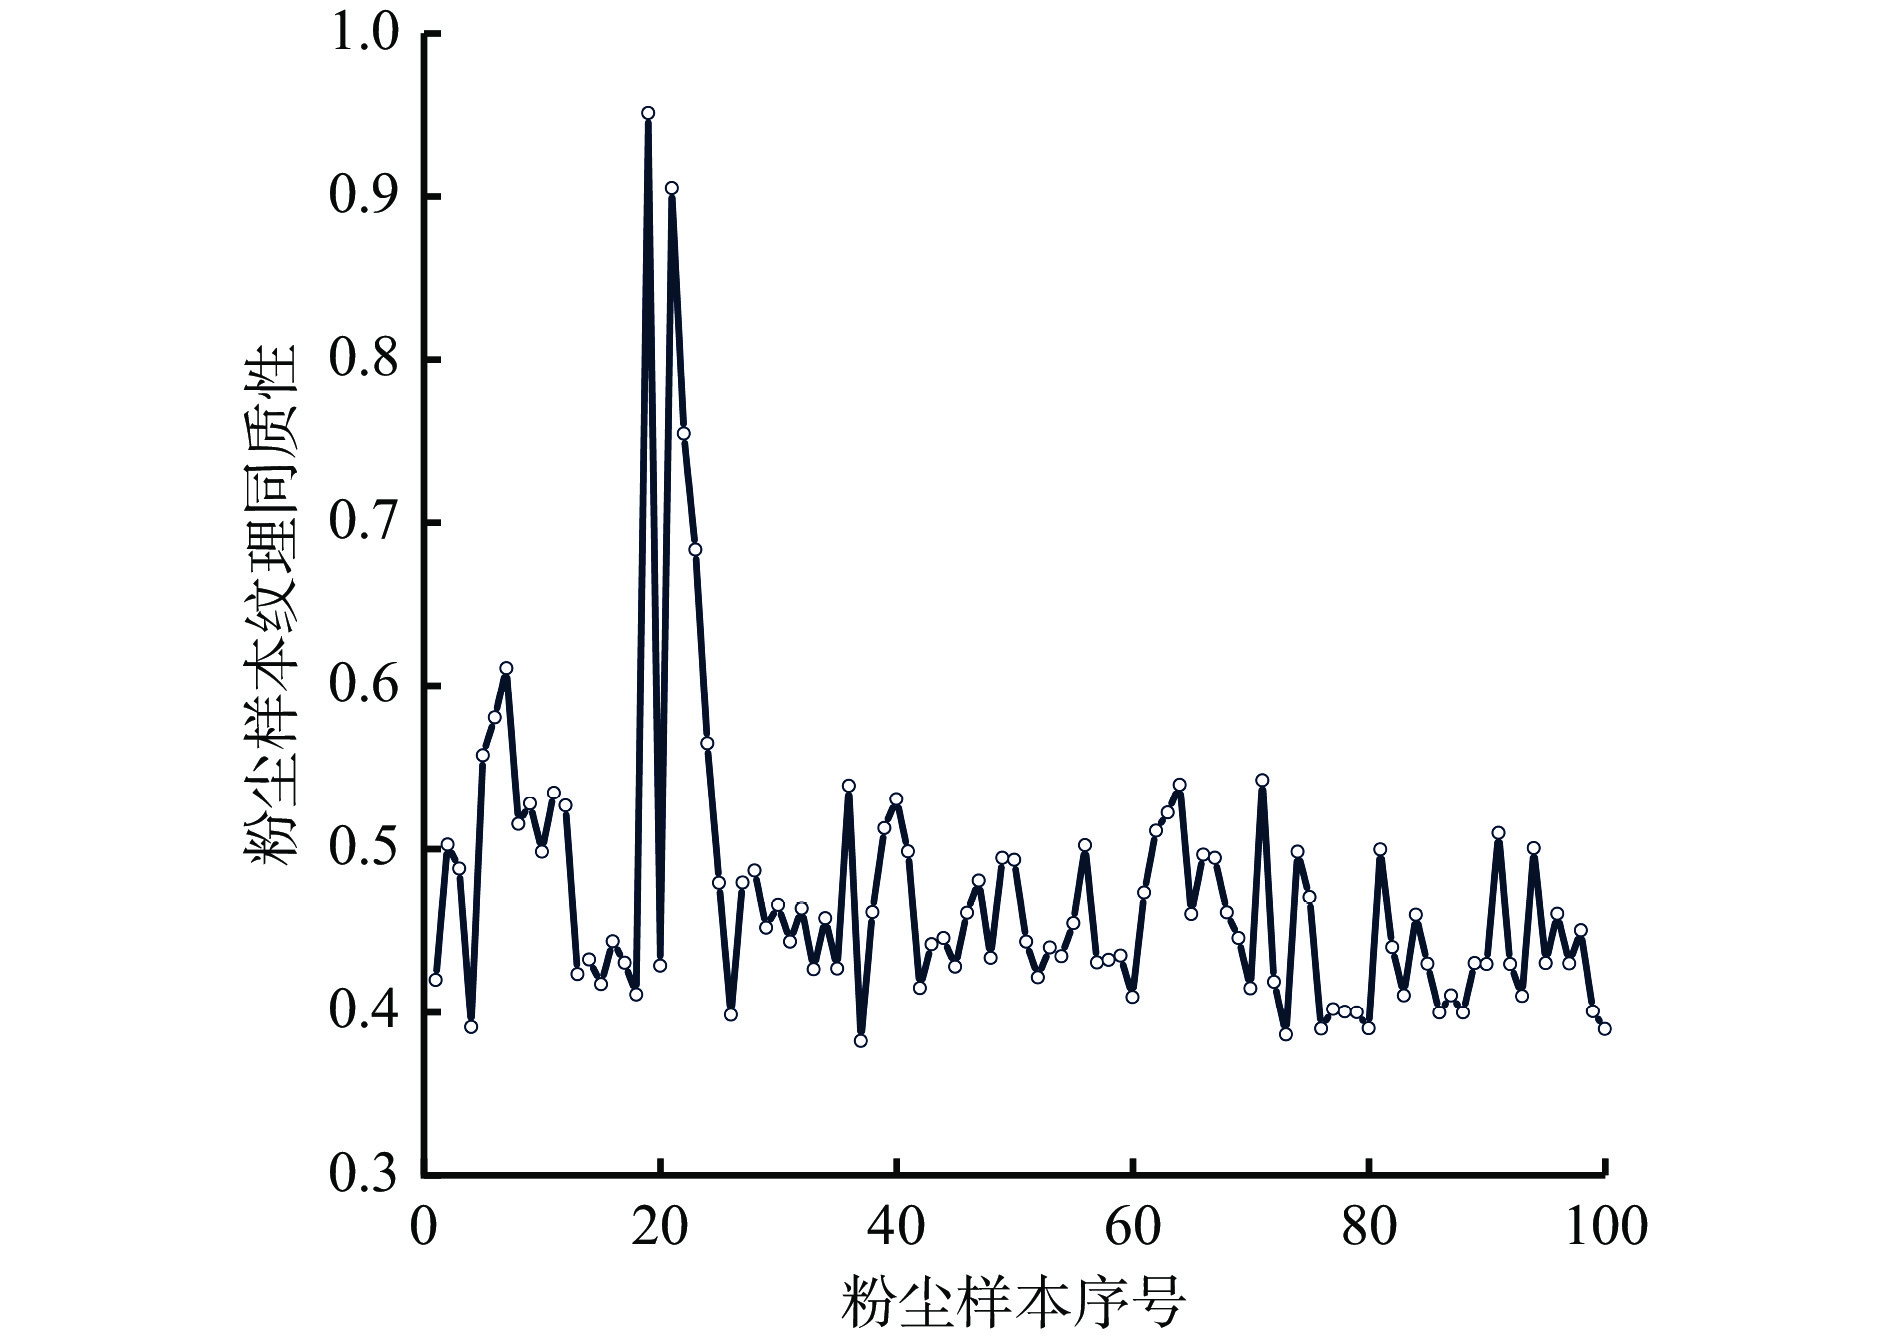
图像 灰度均值 粉尘像素数量与整体图像像素数量的比值/% 角二阶矩 纹理相关性 纹理同质性 纹理对比度 实测粉尘质量浓度/(mg·m−3) 1 129.294 22.41 0.00807 0.92941 0.42040 7.06547 281.25 2 166.347 5.87 0.02956 0.83449 0.50308 4.22411 103.84 3 195.747 2.68 0.02984 0.78039 0.48837 4.91054 79.33 $\vdots $ $\vdots $ $\vdots $ $\vdots $ $\vdots $ $\vdots $ $\vdots $ $\vdots $ 98 157.779 10.76 0.00306 0.91502 0.45065 7.03906 146.87 99 160.324 11.63 0.00308 0.94126 0.40095 6.76993 154.86 100 151.017 9.17 0.00500 0.89669 0.39011 7.41074 136.24  下载: 导出CSV
表 2 实测粉尘质量浓度与特征参数相关性
Table 2. Correlation between the measured dust mass concentration and the feature parameters
特征参量 相关系数 灰度均值 −0.803 83 粉尘像素数量与整体图像像素数量的比值 0.962 32 角二阶矩 −0.298 47 纹理相关性 0.605 03 纹理同质性 −0.379 32 纹理对比度 0.580 04
下载: 导出CSV
表 3 回归模型方差分析结果
Table 3. Variance analysis results of regression models
模型 F 值 P 值 R/% 多元线性模型 767.60 5.29×10⁻¹⁹ 97.00 多元非线性模型 862.31 3.27×10−56 99.30
下载: 导出CSV
表 4 粉尘实测质量浓度与模型计算浓度对比
Table 4. Comparison between the actual concentration of dust and the calculated concentration of the model
实验序号 实测粉尘质量
浓度/(mg·m−3)计算粉尘质量
浓度/(mg·m−3)误差/% 1 281.25 314.93 2.28 2 103.84 114.45 12.73 3 79.33 83.09 3.68 $\vdots $ $\vdots $ $\vdots $ $\vdots $ 98 146.87 172.60 7.79 99 154.86 170.93 6.99 100 136.24 156.20 7.52
下载: 导出CSV
-
[1] 李德文,赵政,郭胜均,等. “十三五”煤矿粉尘职业危害防治技术及发展方向[J]. 矿业安全与环保,2022,49(4):51-58.LI Dewen,ZHAO Zheng,GUO Shengjun,et al. '13th Five-Year Plan' coal mine dust occupational hazard prevention and control technology and development direction[J]. Mining Safety & Environmental Protection,2022,49(4):51-58. [2] 王双明,申艳军,宋世杰,等. “双碳”目标下煤炭能源地位变化与绿色低碳开发[J]. 煤炭学报,2023,48(7):2599-2612.WANG Shuangming,SHEN Yanjun,SONG Shijie,et al. Change of coal energy status and green and low-carbon development under the 'dual carbon' goal[J]. Journal of China Coal Society,2023,48(7):2599-2612. [3] 程卫民,周刚,陈连军,等. 我国煤矿粉尘防治理论与技术20年研究进展及展望[J]. 煤炭科学技术,2020,48(2):1-20.CHENG Weimin,ZHOU Gang,CHEN Lianjun,et al. Research progress and prospect of dust control theory and technology in China's coal mines in the past 20 years[J]. Coal Science and Technology,2020,48(2):1-20. [4] 袁亮. 煤矿粉尘防控与职业安全健康科学构想[J]. 煤炭学报,2020,45(1):1-7.YUAN Liang. Scientific conception of coal mine dust control and occupational safety[J]. Journal of China Coal Society,2020,45(1):1-7. [5] 陈继民,陈鹤天. 激光在粉尘检测领域的进展与应用[J]. 应用激光,2018,38(3):496-501.CHEN Jimin,CHEN Hetian. The development and application of laser in dust detection[J]. Applied Laser,2018,38(3):496-501. [6] 王智超,吴占松,杨英霞,等. 粉尘质量浓度测试方法的实验研究[J]. 清华大学学报(自然科学版),2013,53(3):366-370.WANG Zhichao,WU Zhansong,YANG Yingxia,et al. Experimental study of test method for dust mass concentration[J]. Journal of Tsinghua University(Science and Technology),2013,53(3):366-370. [7] HALTERMAN A,SORSAN A,PETERS T M. Comparison of respirable mass concentrations measured by a personal dust monitor and a personal dataRAM to gravimetric measurements[J]. Annals of Work Exposures and Health,2017,62(1):62-71. [8] 王凯,张霞,苏瑾. 地铁站中PM(2.5)和PM(10)光散射法与滤膜称重法比对[J]. 实用预防医学,2021,28(12):1539-1542.WANG Kai,ZHANG Xia,SU Jin. Comparison of PM(2.5) and PM(10) mass concentration in subway measured by light scattering method and gravimetric method[J]. Practical Preventive Medicine,2021,28(12):1539-1542. [9] 简亚婷,高军,肖卫民,等. 微量振荡天平法确定激光粉尘仪大气颗粒物转换系数[J]. 井冈山大学学报(自然科学版),2014,35(3):1-6.JIAN Yating,GAO Jun,XIAO Weimin,et al. Using tapered element oscillating microbalance method to determine the conversion coefficient of atmospheric particulate matter tested by laser dust monitor[J]. Journal of Jinggangshan University (Natural Science),2014,35(3):1-6. [10] 靳燕,王晓东. 基于β射线和光散射法的颗粒物测量系统[J]. 山西电子技术,2022(4):27-28,35.JIN Yan,WANG Xiaodong. An atmospheric particulate matter measurement system based on β-ray and light scattering method[J]. Shanxi Electronic Technology,2022(4):27-28,35. [11] 陈建阁,李德文,许江,等. 基于光散射法无动力粉尘质量浓度检测技术[J]. 煤炭学报,2023,48(增刊1):149-158.CHEN Jiange,LI Dewen,XU Jiang,et al. Detection technology of unpowered dust concentration based on light scattering method[J]. Journal of China Coal Society,2023,48(S1):149-158. [12] 颜鸽来,刘国庆. 基于主动荷电的电荷感应粉尘浓度检测技术[J]. 电子设计工程,2023,31(10):111-116.YAN Gelai,LIU Guoqing. Charge-induced dust concentration detection technology based on active charging[J]. Electronic Design Engineering,2023,31(10):111-116. [13] 丁喜波,王珊,邹一风. 基于超声波声衰减的甲烷浓度测量方法[J]. 应用基础与工程科学学报,2018,26(3):672-679.DING Xibo,WANG Shan,ZOU Yifeng. The method of methane concentration measurement based on ultrasonic sound attenuation[J]. Journal of Basic Science and Engineering,2018,26(3):672-679. [14] 陈锋,夏凤毅,罗爱爱. 基于图像法的粉尘浓度检测[C]. 《环境工程》2019年全国学术年会,北京,2019:179-183.CHEN Feng,XIA Fengyi,LUO Aiai. Dust concentration detection based on image method[C]. 2019 National Academic Annual Conference by Environmental Engineering,Beijing,2019:179-183. [15] 刘丹丹,侯展博,胡丙阳,等. 基于CCD图像的粉尘浓度面维度分布测量方法[J]. 黑龙江科技大学学报,2023,33(1):99-102. doi: 10.3969/j.issn.2095-7262.2023.01.017LIU Dandan,HOU Zhanbo,HU Bingyang,et al. Surface dimension distribution measurement method of dust concentration based on CCD image[J]. Journal of Heilongjiang University of Science and Technology,2023,33(1):99-102. doi: 10.3969/j.issn.2095-7262.2023.01.017 [16] 叶方平,方朝阳,徐显金,等. 基于图像透光率的粉尘浓度测量算法研究[J]. 应用光学,2022,43(3):496-502. doi: 10.5768/JAO202243.0303005YE Fangping,FANG Chaoyang,XU Xianjin,et al. Dust concentration measurement algorithm based on image transmittance[J]. Journal of Applied Optics,2022,43(3):496-502. doi: 10.5768/JAO202243.0303005 [17] 刘伟华,袁伟. 基于图像分析的煤尘在线监测系统[J]. 电子测量技术,2010,33(1):125-128,146.LIU Weihua,YUAN Wei. Investigation of on-line monitoring instrument used in coal dusts based on image analysis[J]. Electronic Measurement Technology,2010,33(1):125-128,146. [18] KONOSHONKIN A,KUSTOVA N,BOROVOI A,et al. Using the physical optics approximation for estimating the light scattering properties of large dust particles for lidar applications[C]. The 29th Interational Laser Radar Conference,2020. DOI: 10.1051/J.EPJCONF/202023708025. [19] BAAGA D,KALITA M,DOBRZANIECKI P,et al. Analysis and forecasting of PM2.5,PM4,and PM10 dust concentrations,based on in situ tests in hard coal mines[J]. Energies,2021,14. DOI: 10.3390/en14175527. [20] BADDOCK M C,STRONG C L,KEYS J F,et al. A visibility and total suspended dust relationship[J]. Atmospheric Environment,2014,89:329-336. doi: 10.1016/j.atmosenv.2014.02.038 -


 点击查看大图
计量
- 文章访问数: 134
- HTML全文浏览量: 38
- PDF下载量: 40
- 被引次数: 0
